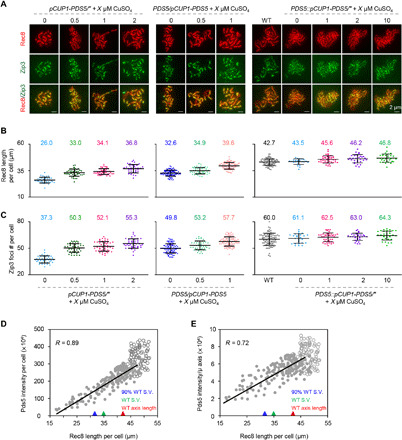
Fig. 3. Pds5 dosage-dependently regulates axis length.

(A) Representative images of Rec8 and Zip3 staining. Scale bar, 2 μm. (B and C) Quantification of the total length of Rec8 lines per cell (B) and the total number of Zip3 foci per cell (C). Sample size, n = 39, 44, 49, 41, 97, 47, 84, 105, 25, 41, 31, and 32, separately. Error bar, means ± SD (B and C). (D and E) Nuclei with longer axis have more Pds5 per nucleus (D) and per micrometer of the axis (E) as shown by Pearson’s correlation analysis. The trend lines and correlation coefficient were calculated on the basis of presented data (n = 268), except for data points from the strain with overexpressed Pds5 (circles). Triangles indicate the axis length and Pds5 intensity per nucleus (D) and per micrometer of the axis (E) in strains with 90% of WT level of spore viability (S.V.) (blue triangle), WT level of spore viability (green triangle), and WT axis length (red triangle).
