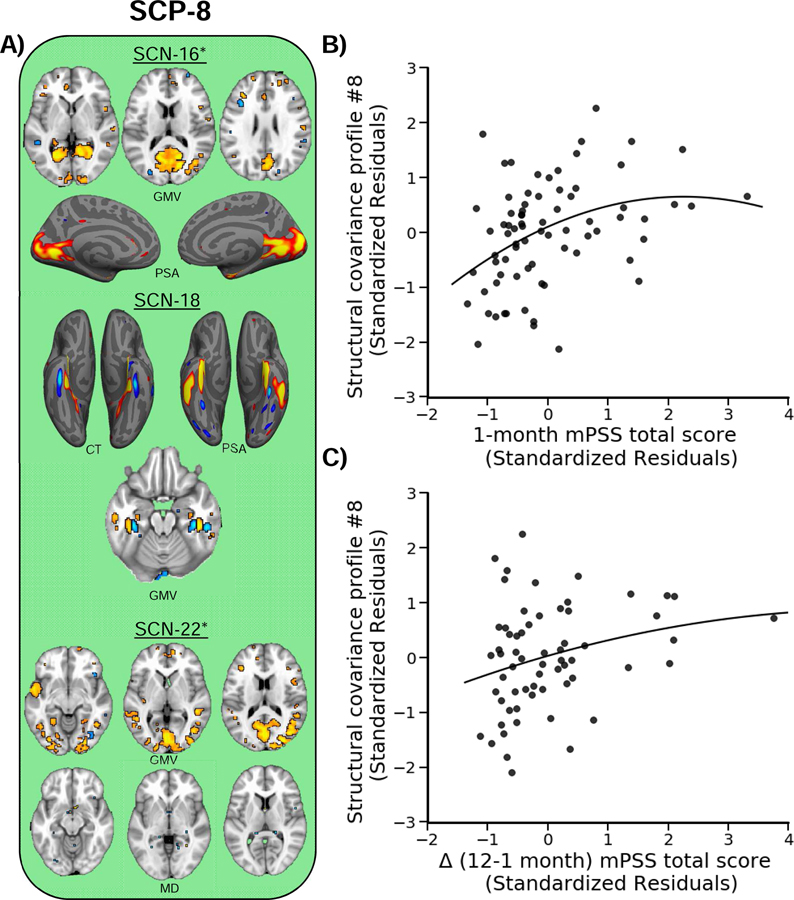
Figure 2. Structural covariance profile eight (SCP-8) varies with posttraumatic stress severity.
A) SCP-8 reflected GMV, PSA, and MD of the visual cortex, anterior temporal lobe, and fusiform gyrus. The loading for this profile varied curvilinearly with both B) mPSS scores at 1 month and C) the change in mPSS scores between 1 and 12 months. Warm colors (red/yellow/orange) reflect positive, and cool colors (blue/light blue) reflect relative negative, relationships of each modality with each SCN loading. Plots represent the standardized residuals for the SCP and mPSS scores to show the unique curvilinear relationship between the variables, accounting for covariates. Dots represent individual participant points and the solid line represents the line of best fit. Asterisks indicate other modalities contributed significant (i.e., greater than or equal to 15%) to the SCN, however no voxels survived the |2| threshold.

