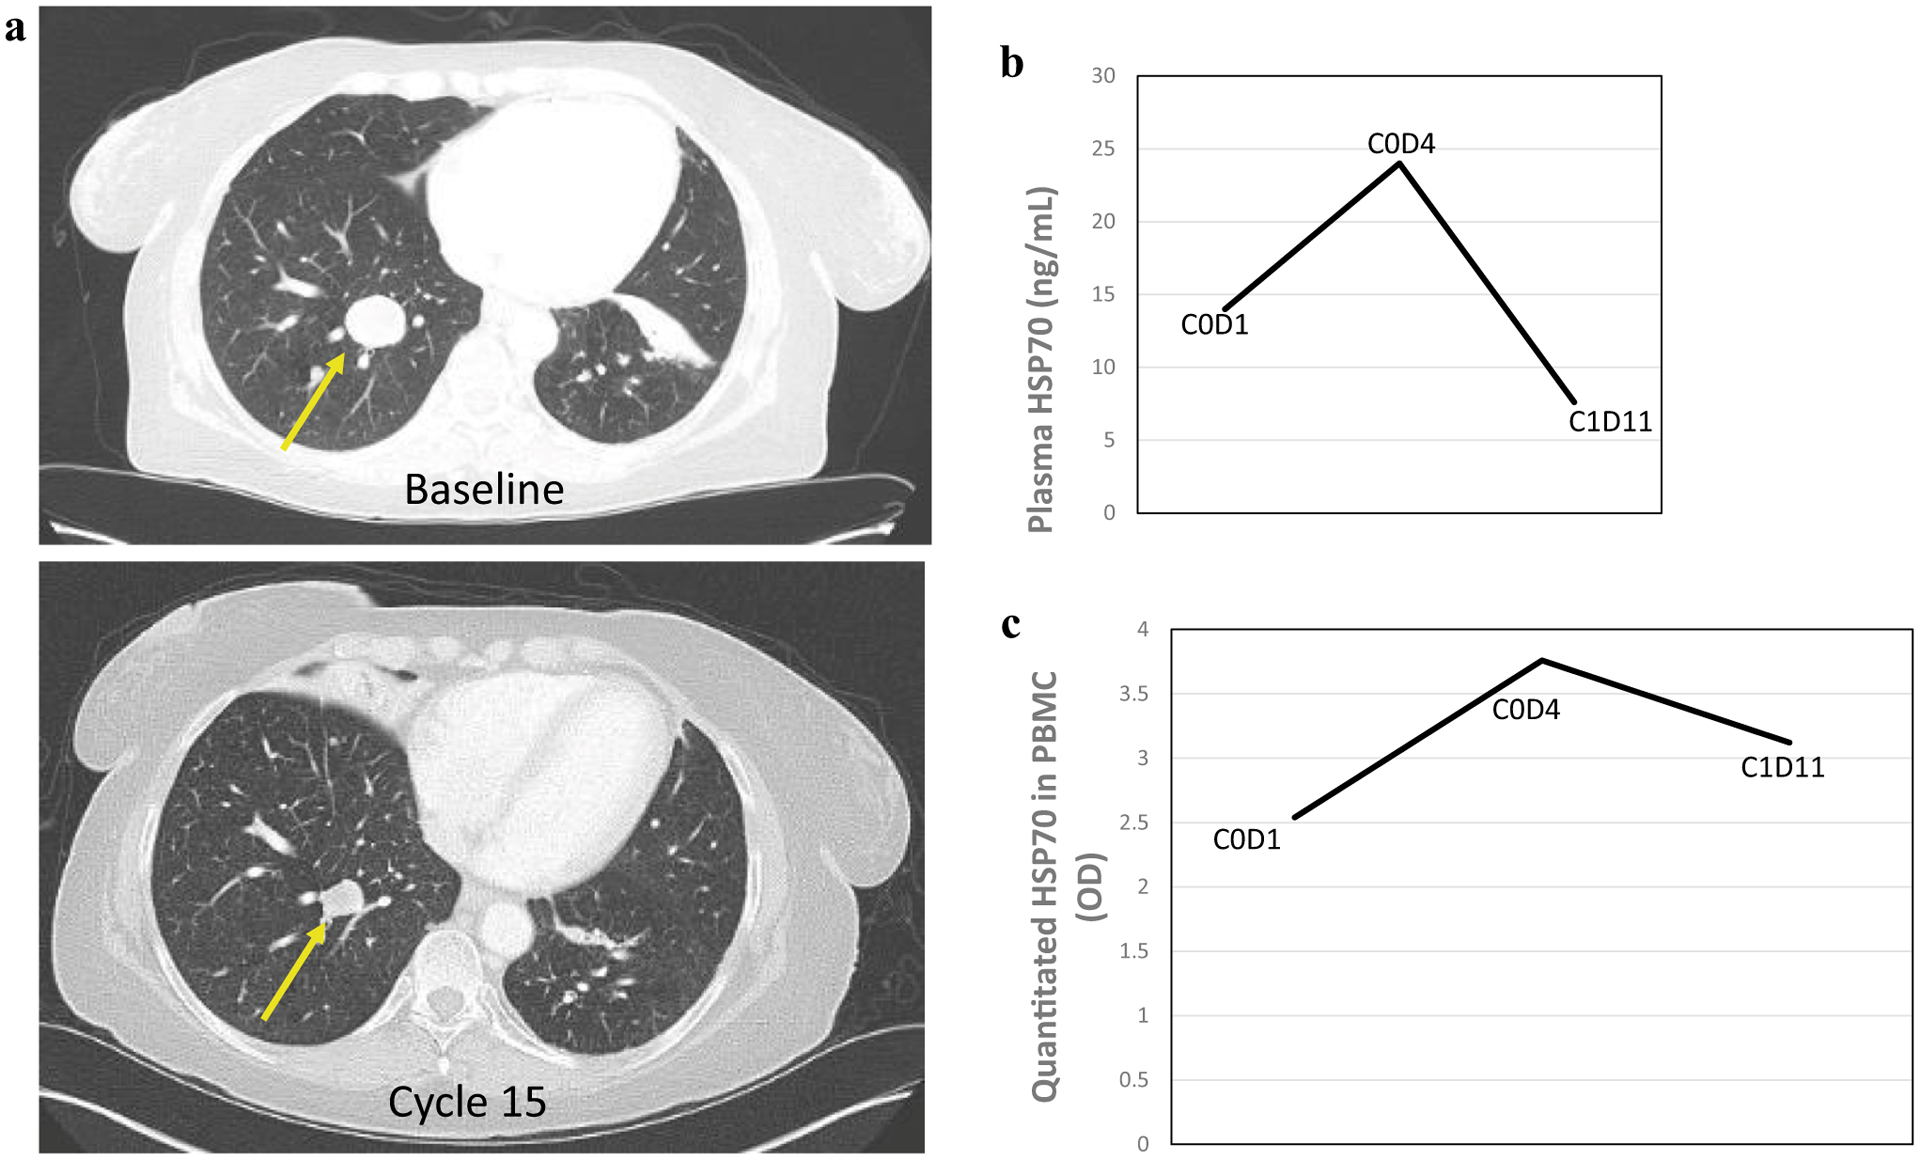
Fig. 3.

Clinical response a patient with adenocarcinoma of the palate with corresponding HSP70 measurements in plasma and PBMC. a Computed tomography scan demonstrating partial response of thoracic metastases (arrow) at baseline (Top) and at 13 cycles (Bottom). Right-sided panels show corresponding: b changes in soluble HSP70 protein expression in plasma as measured by ELISA at C0D1, C0D4 and C1D11; and c ImageQuant quantitated changes in HSP70 protein expression as measured by western blot in PBMCs at C0D1, C0D4 and C1D11
