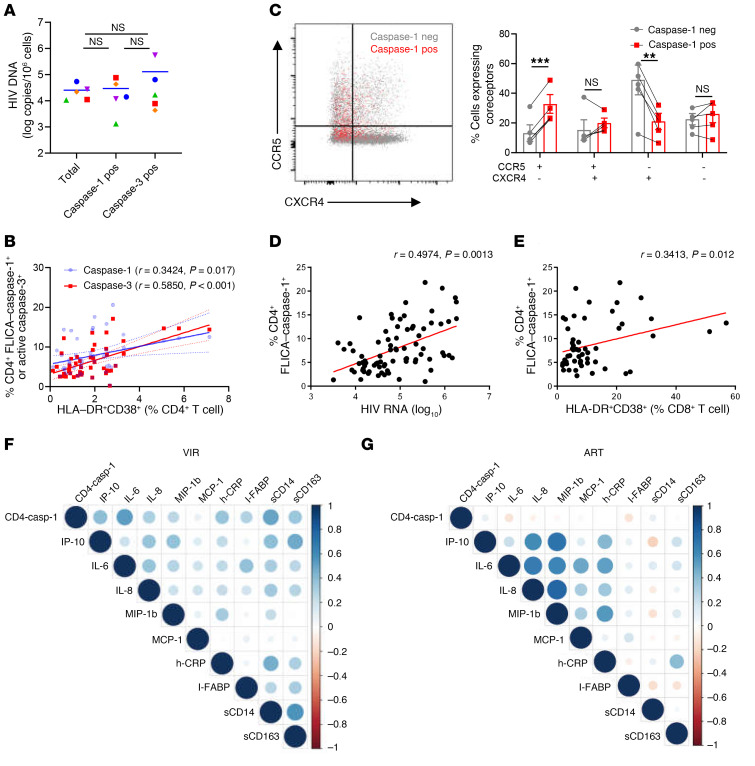
Figure 2. Activation of caspase-1 in CD4+ T cells correlates with both viral load and inflammation.
(A) Isolation of total, FLICA–caspase-1+, and active caspase-3+ CD4+ T cells from PBMCs of VIR patients (n = 5). HIV DNA in different cell fractions was detected. Wilcoxon’s matched-pairs signed-rank test was performed. (B) Correlation of HLA-DR+CD38+ CD4+ T cells with FLICA–caspase-1+ and active caspase-3+ CD4+ T cells. (C) The expression of HIV-1 coreceptor CCR5 and CXCR4 on FLICA–caspase-1+ (red dots) and FLICA–caspase-1– CD4+ T cells (gray dots) in VIR patients (n = 5). neg, negative. (D and E) Correlation of FLICA–caspase-1 frequency in CD4+ T cells with HIV-1 viral load (D) and activation of CD8+ T cells (HLA-DR+CD38+ CD8+ T cells) (E) in VIR patients (n = 80). The HIV-1 viral load is represented on a log10 scale. (F and G) Correlation matrix of FLICA–caspase-1 frequency in CD4+ T cells and plasma inflammatory markers in VIR patients and ART patients. Levels of sCD14, sCD163, I-FABP, and h-CRP were detected by ELISA, and other cytokines were measured by Luminex assay. The size and color density of circles are proportional to the correlation between 2 variables in VIR patients (D) or ART patients (E). Associations were evaluated using Spearman’s correlation test. P and Spearman’s ρ values are presented. Wilcoxon’s signed-rank test (A and C); **P < 0.01, ***P < 0.001.

