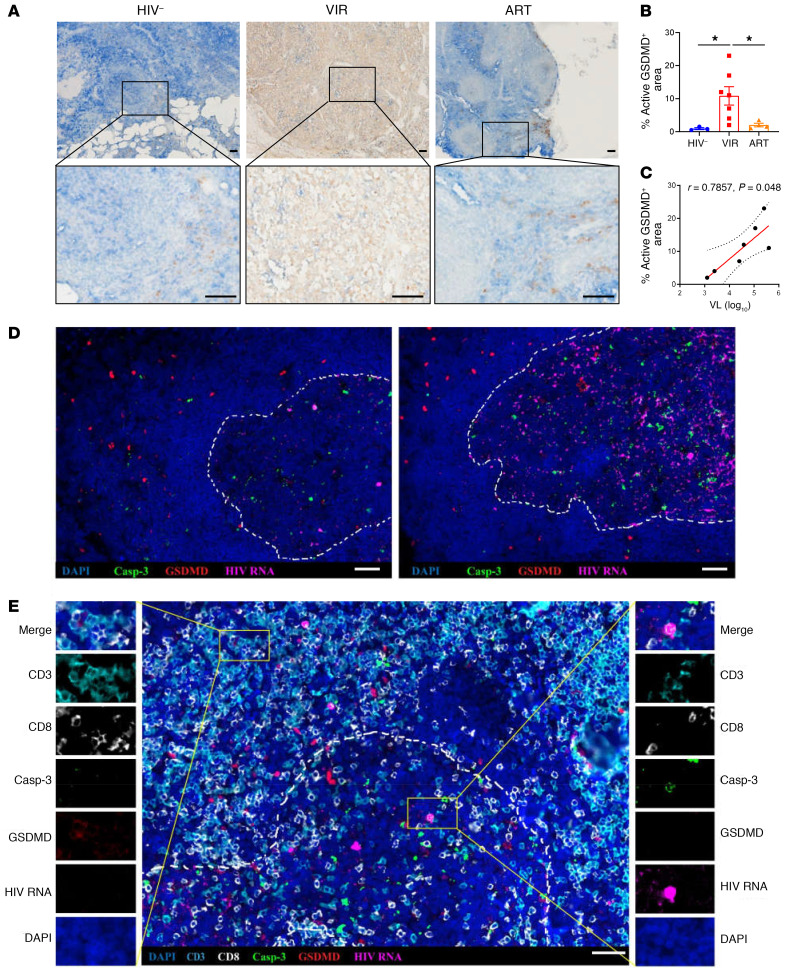
Figure 3. Increased GSDMD activation in lymph nodes of HIV-1–infected patients.
(A) Representative examples of LNs from HIV-negative patients (n = 3) (left), VIR patients (n = 7) (middle), and ART patients (n = 4) (right) stained with anti–active GSDMD antibody shown at low (top panels) and high (bottom panels) magnification. Scale bars: 50 μm. (B) Quantification of active GSDMD was performed using ImageJ. Mann-Whitney U tests were used to evaluate statistically significant differences. (C) Spearman’s correlation between percentage of active GSDMD–positive area and HIV-1 viral load (VL) in VIR patients (n = 7). P and Spearman’s ρ values are presented. (D) Representative immunofluorescence microscopy images of LN sections from VIR patients hybridized with HIV-1 viral RNA and stained with anti–active caspase-3 and anti–active GSDMD antibodies, as indicated. (E) Representative immunofluorescence microscopy images of LN sections from VIR patients hybridized with HIV-1 viral RNA and stained with anti-CD3, anti-CD8, anti–active caspase-3, and anti–active GSDMD antibodies, as indicated. High-magnification fields show each fluorescence channel of representative images of pyroptotic and apoptotic cells at both sides of the main panel. Dashed lines represent B cell follicle limits. Scale bars: 50 μm. *P < 0.05.

