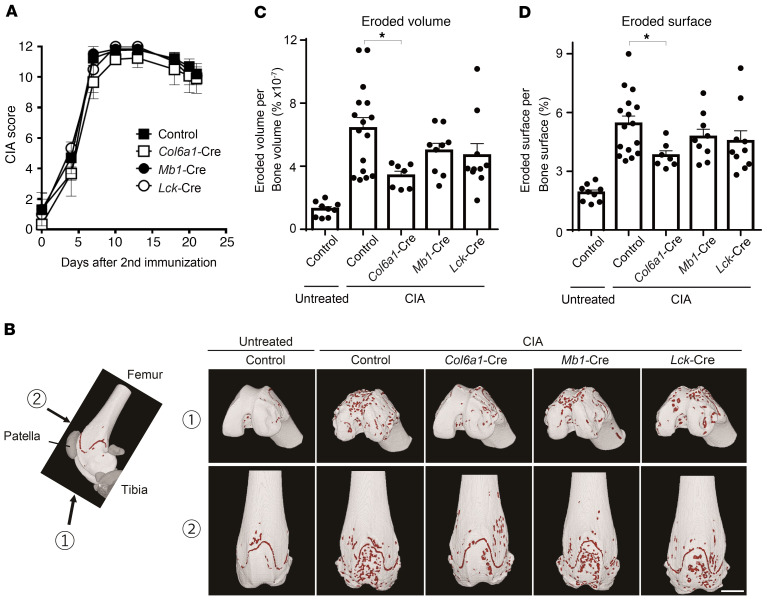
Figure 3. Synovial fibroblast RANKL, but not the RANKL derived from B-lineage cells, is responsible for joint destruction.
(A) CIA score of Tnfsf11fl/Δ, Col6a1-Cre Tnfsf11fl/Δ, Mb1-Cre Tnfsf11fl/Δ, and Lck-Cre Tnfsf11fl/Δ mice on a DBA1/J background (n = 3). (B) μCT images of the knee joints of arthritic mice 3 weeks after the secondary immunization. The red area shows cavities of femurs. Scale bar: 1 mm. Representative data are shown. (C and D) Eroded volume per bone volume (C) and eroded surface per bone surface (D) of the knee joint of naive Tnfsf11fl/Δ, CIA Tnfsf11fl/Δ, Col6a1-Cre Tnfsf11fl/Δ, Mb1-Cre Tnfsf11fl/Δ, and Lck-Cre Tnfsf11fl/Δ mice (n = 7–16). All data are expressed as the mean ± SEM. *P < 0.05 by 1-way ANOVA with the Holm-Sidak multiple-comparison test.

