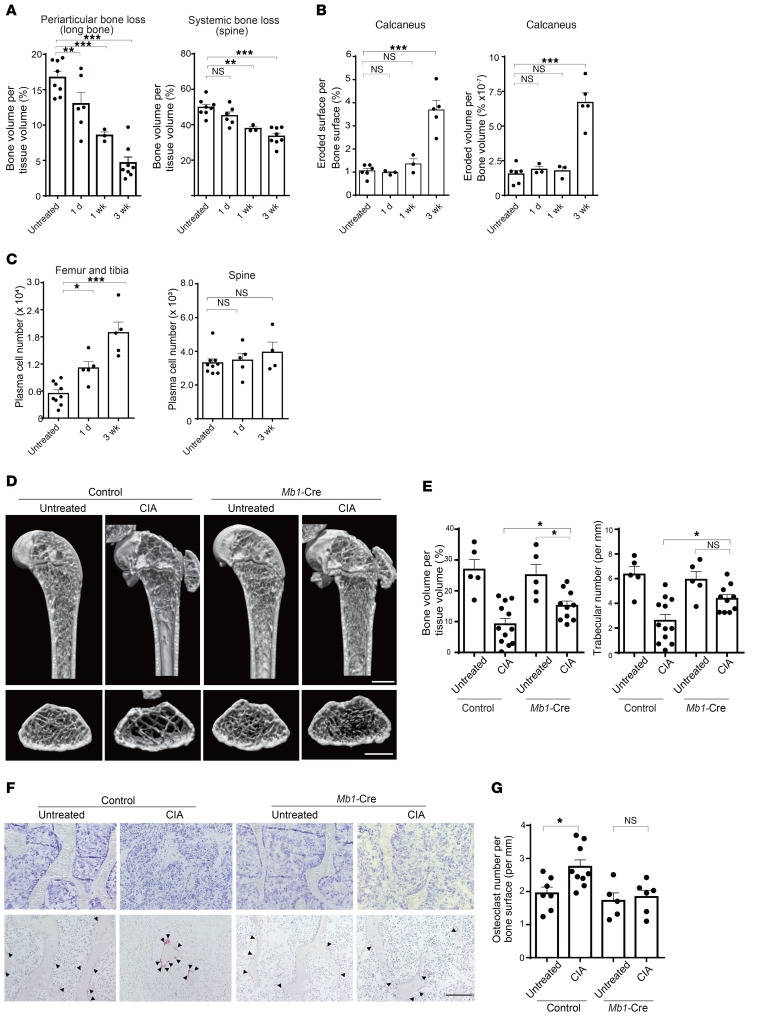
Figure 4. RANKL produced by B-lineage cells contributes to the periarticular bone loss in arthritis.
(A and B) Association of periarticular bone loss with an increase in the bone marrow plasma cell number. Bone volume per tissue volume of the distal femur (A, left, n = 3–8) and lumbar spine (L5) (A, right, n = 3–8) and joint erosion of the calcaneus bone (B, n = 3–6) during the course of CIA. (C) Number of plasma cells in femur and tibia (left) and lumber spine (L1–L3, right) during the course of CIA. (D) Representative μCT images of the distal femur of arthritic mice. Scale bars: 1 mm. (E) Bone volume per tissue volume (left) and the trabecular bone number (right) of distal femurs of arthritic mice 3 weeks after the secondary immunization (n = 5–11). (F and G) Representative TRAP+ staining (F) and the numbers of TRAP+ multinucleated cells per bone surface (G) of the tibia of arthritic mice (n = 5–9). Scale bar: 100 μm. All data are expressed as the mean ± SEM. *P < 0.05; **P < 0.01; ***P < 0.001 by 1-way ANOVA with the Holm-Sidak multiple-comparison test (A–C) or 2-way ANOVA with the Holm-Sidak multiple-comparison test (E and G). NS, not significant.

