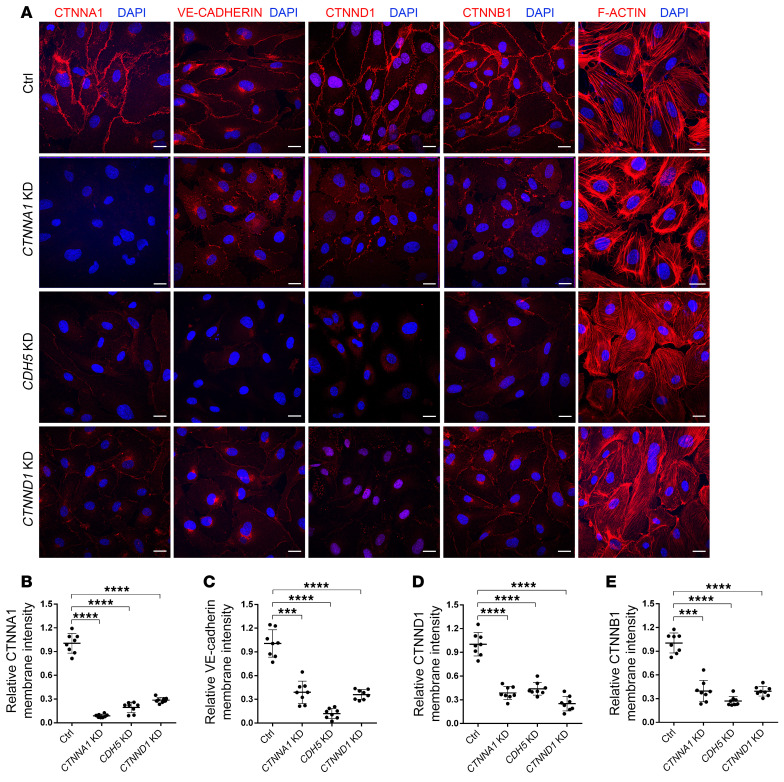
Figure 3. CTNNA1, CDH5, and CTNND1 are essential for the integrity of the cadherin-catenin complex in HRECs.
(A) Immunofluorescence images of HRECs transfected with an shRNA targeting CTNNA1, CDH5, and CTNND1 or a control shRNA. Anti-CTNNA1, VE-cadherin, CTNND1, CTNNB1, or F-actin antibody (red) was costained with DAPI (blue). Scale bars: 25 μm. (B–E) Quantification of membrane signal intensity of CTNNA1, VE-cadherin, CTNND1, and CTNNB1 in CTNNA1-, CDH5-, CTNND1-KD, and control (Ctrl) HRECs. Error bars indicate the SD. ***P < 0.001 and ****P < 0.0001, by 1-way ANOVA with Dunnett’s multiple-comparison test (n = 8). Experiments were performed independently at least 3 times.

