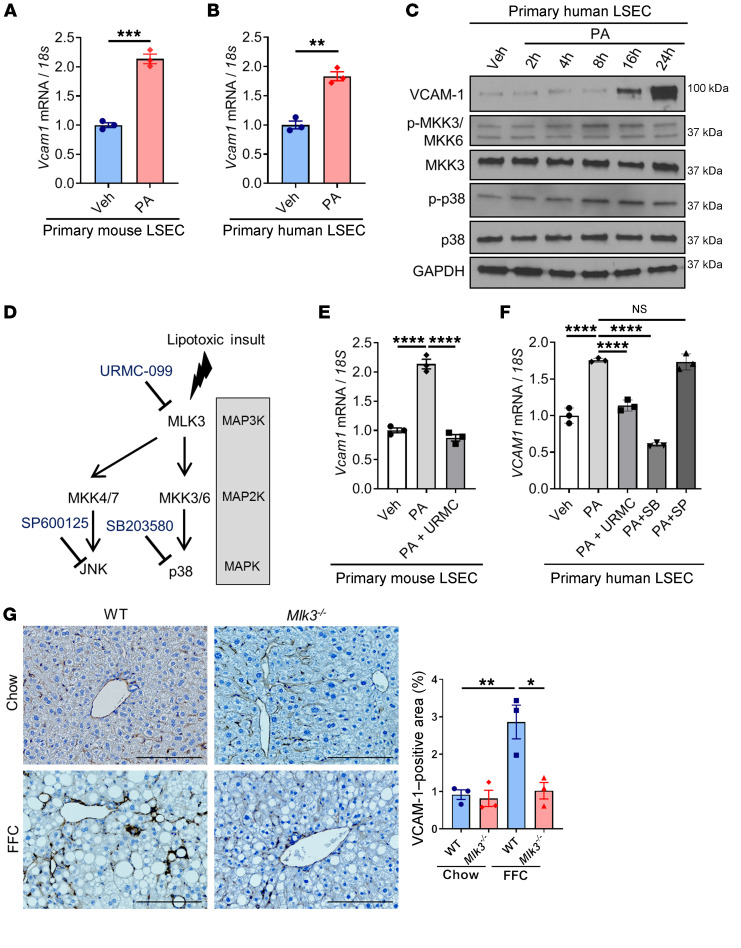
Figure 4. VCAM-1 is upregulated in LSECs under lipotoxic conditions via a MAPK pathway.
(A) Primary mouse LSECs were treated with vehicle (Veh) or 250 μM of PA for 16 hours. (B) Primary human LSECs were treated with vehicle or 500 μM of PA for 16 hours. The mRNA expression levels of Vcam1 were evaluated by real-time qPCR. FC was determined after normalization to 18S rRNA expression and expressed as FC to that observed in vehicle-treated cells. (C) Primary human LSECs were treated with 500 μM of PA. Protein levels of VCAM-1, phosphorylated and total MKK3/6, and p38 were assessed by Western blot. GAPDH was used as a loading control. (D) Schematic representation of the MAPK pathway and its inhibitors. (E) Primary mouse LSECs were treated with 250 μM of PA ± 2 μM of the MLK3 inhibitor URMC-099 (URMC) for 16 hours. (F) Primary human LSECs were treated with 500 μM of PA ± 2 μM of URMC or 10 μM of p38 inhibitor SB203580 (SB) or 20 μM of the JNK inhibitor SP600125 (SP) for 16 hours. The mRNA expression levels of Vcam1 were evaluated by real-time qPCR. (G) Eight-week-old WT C57BL/6J mice (WT) or mice with whole body Mlk3 knockout (Mlk3–/–) were fed either chow or FFC diet for 24 weeks to induce NASH. Representative images of VCAM-1 immunostaining of liver tissue sections are shown. Scale bars: 100 μm. VCAM-1–positive areas were quantified in 5 random ×10 microscopic fields and averaged for each animal (n = 3 per group). Graphs represent mean ± SEM. *P < 0.05, **P < 0.01, ***P < 0.001, ****P < 0.0001, unpaired t test and 1-way ANOVA with Bonferroni’s multiple comparison.

