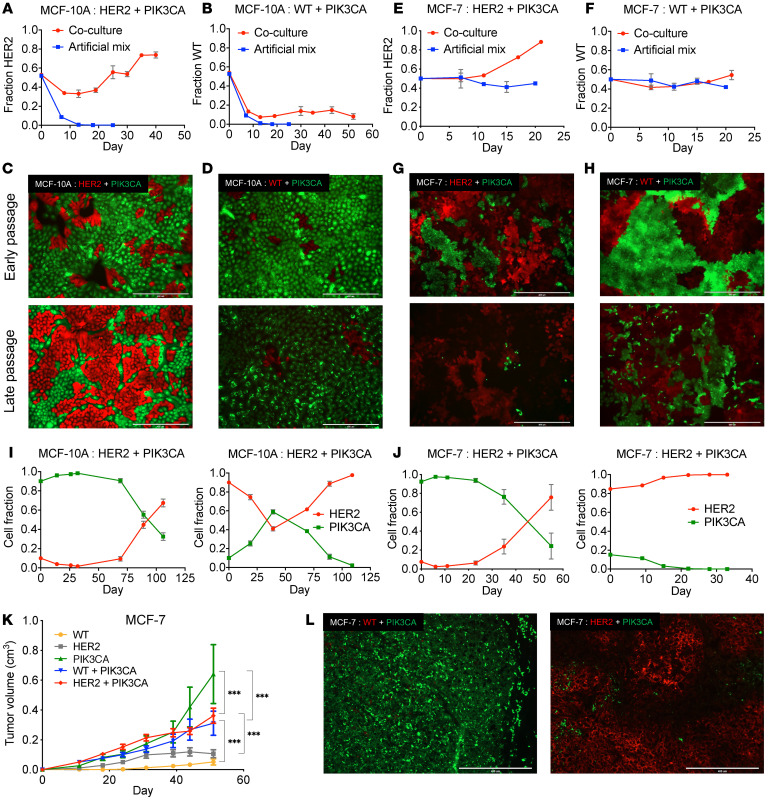
Figure 1. Interactions between HER2 and PIK3CA mutant cells result in altered, nonrandom growth dynamics.
(A) Coculture of MCF-10A cells containing a HER2 mutation and those containing a PIK3CA mutation. Genomic DNA was collected upon confluency for analysis by ddPCR. Artificial mixes were obtained as described in Supplemental Figure 1. The fraction of HER2 cells was plotted as the mean ± SEM (n = 3). (B) Coculture of MCF-10A WT cells and those containing a PIK3CA mutation carried out as described in A. (C) Representative images of cocultures using fluorescently labeled HER2 mutants (red) and PIK3CA mutants (green) and (D) cocultures using fluorescently labeled MCF-10A WT cell (red) and PIK3CA mutants (green). Top image is early passage (approximately 10 days) and bottom image is late passage (approximately 40 days for MCF-10A and 25 days for MCF-7). Scale bars: 400 μM. (E) Coculture assays of MCF-7 background cells containing a HER2 mutation or (F) corrected WT MCF-7 cells, as performed in A. (G) Representative images of cocultures using fluorescently labeled MCF-7 HER2 mutants (red) and PIK3CA mutants (green) and (H) cocultures using fluorescently labeled MCF-7 WT cells (red) and PIK3CA mutants (green). Scale bars: 400 μM. (I) Cocultures of HER2 and PIK3CA mutant cells with skewed starting ratios in the MCF-10A and (J) MCF-7 backgrounds. Cellular fractions were determined by ddPCR (mean ± SEM, n = 2). (K) Xenograft study of MCF-7 panel (WT, HER2, and PIK3CA mutation). Subcutaneous injection of athymic nude mice with estrogen supplementation. Cells were inoculated individually (n = 5) and in coinoculations of HER2:PIK3CA or WT:PIK3CA (n = 10). ***P < 0.001 by 2-way ANOVA followed by Bonferroni multiple comparisons test. (L) Representative fluorescence images of cryosectioned coinoculated tumors. Left, WT (red) and PIK3CA mutant (green); right, HER2 mutant (red) and PIK3CA mutant (green). Scale bars: 400 μM.

