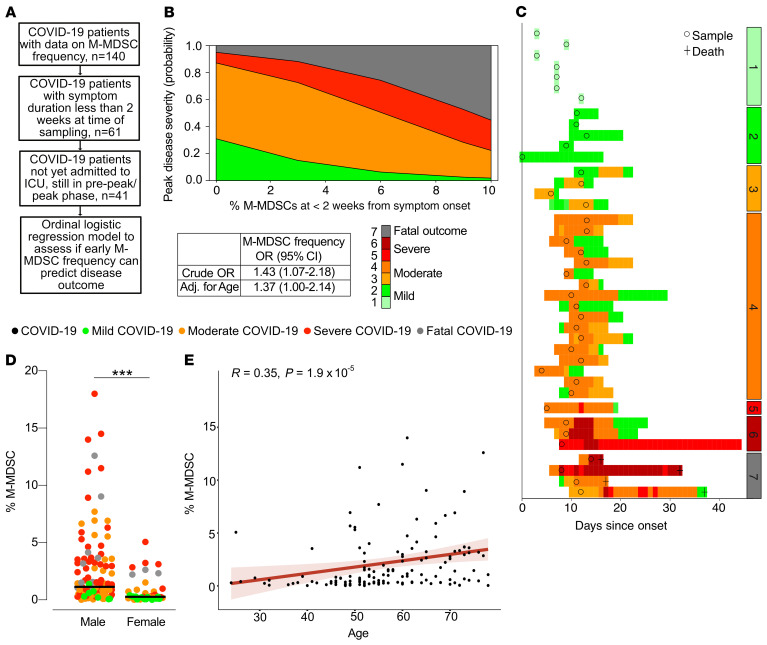
Figure 6. M-MDSC frequency predicts disease severity and is associated with male sex and age.
(A) Criteria for inclusion in the ordinal logistic regression model. Only patients with symptoms for up to 2 weeks, not yet admitted to the ICU, and in the pre-peak or peak phase were included in the analysis. (B) Proportional odds logistic regression showing the capacity of M-MDSC frequency to predict the peak disease severity score. Crude and adjusted (Adj.) ORs are presented. (C) Overview of the 41 patients included in the ordinal logistic regression model. Circles represent the samples included in the analysis, and colors represent the daily disease severity. Patients were separated on the basis of peak disease severity. (D) Peak M-MDSC frequency in men and women with COVID-19 compared using a Wilcoxon-Mann-Whitney U test.***P < 0.001. Circles are color-coded by disease severity. Men: mild, n = 7; moderate, n = 40; severe, n = 47; and fatal, n = 9. Women: mild, n = 12; moderate, n = 13; severe, n = 9; and fatal, n = 3. (E) Spearman’s correlation between age and peak M-MDSC frequency (n = 140).

