Figure 2.

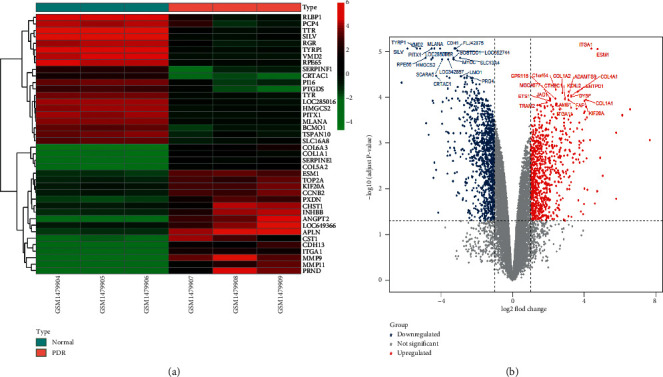
Heatmap (a) and volcano plot (b) of DEmRNAs (PDR targets) in microarray dataset GSE60436. The top 20 downregulated and upregulated DEmRNAs are shown in the heatmap and the volcano plot.

Heatmap (a) and volcano plot (b) of DEmRNAs (PDR targets) in microarray dataset GSE60436. The top 20 downregulated and upregulated DEmRNAs are shown in the heatmap and the volcano plot.