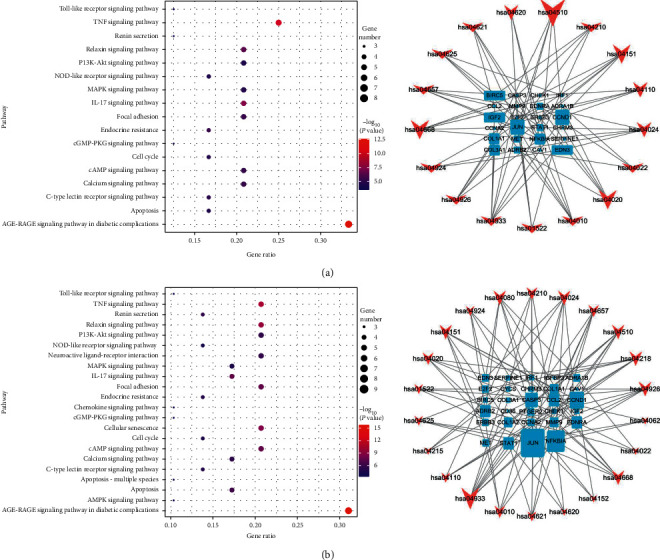
Figure 7.

Kyoto Encyclopedia of Genes and Genomes (KEGG) pathway analysis results (left) and KEGG-target networks (right). In the right panel, the arrows and squares represent pathways and potential therapeutic targets, respectively. The size of the arrows represents the ratio of the corresponding therapeutic targets, while the size of the therapeutic targets represents the ratio of the corresponding pathways. (a) Pathways enriched with targets of the compound Xueshuantong capsule. (b) Pathways enriched with targets of the Hexuemingmu tablet.
