Figure 5.

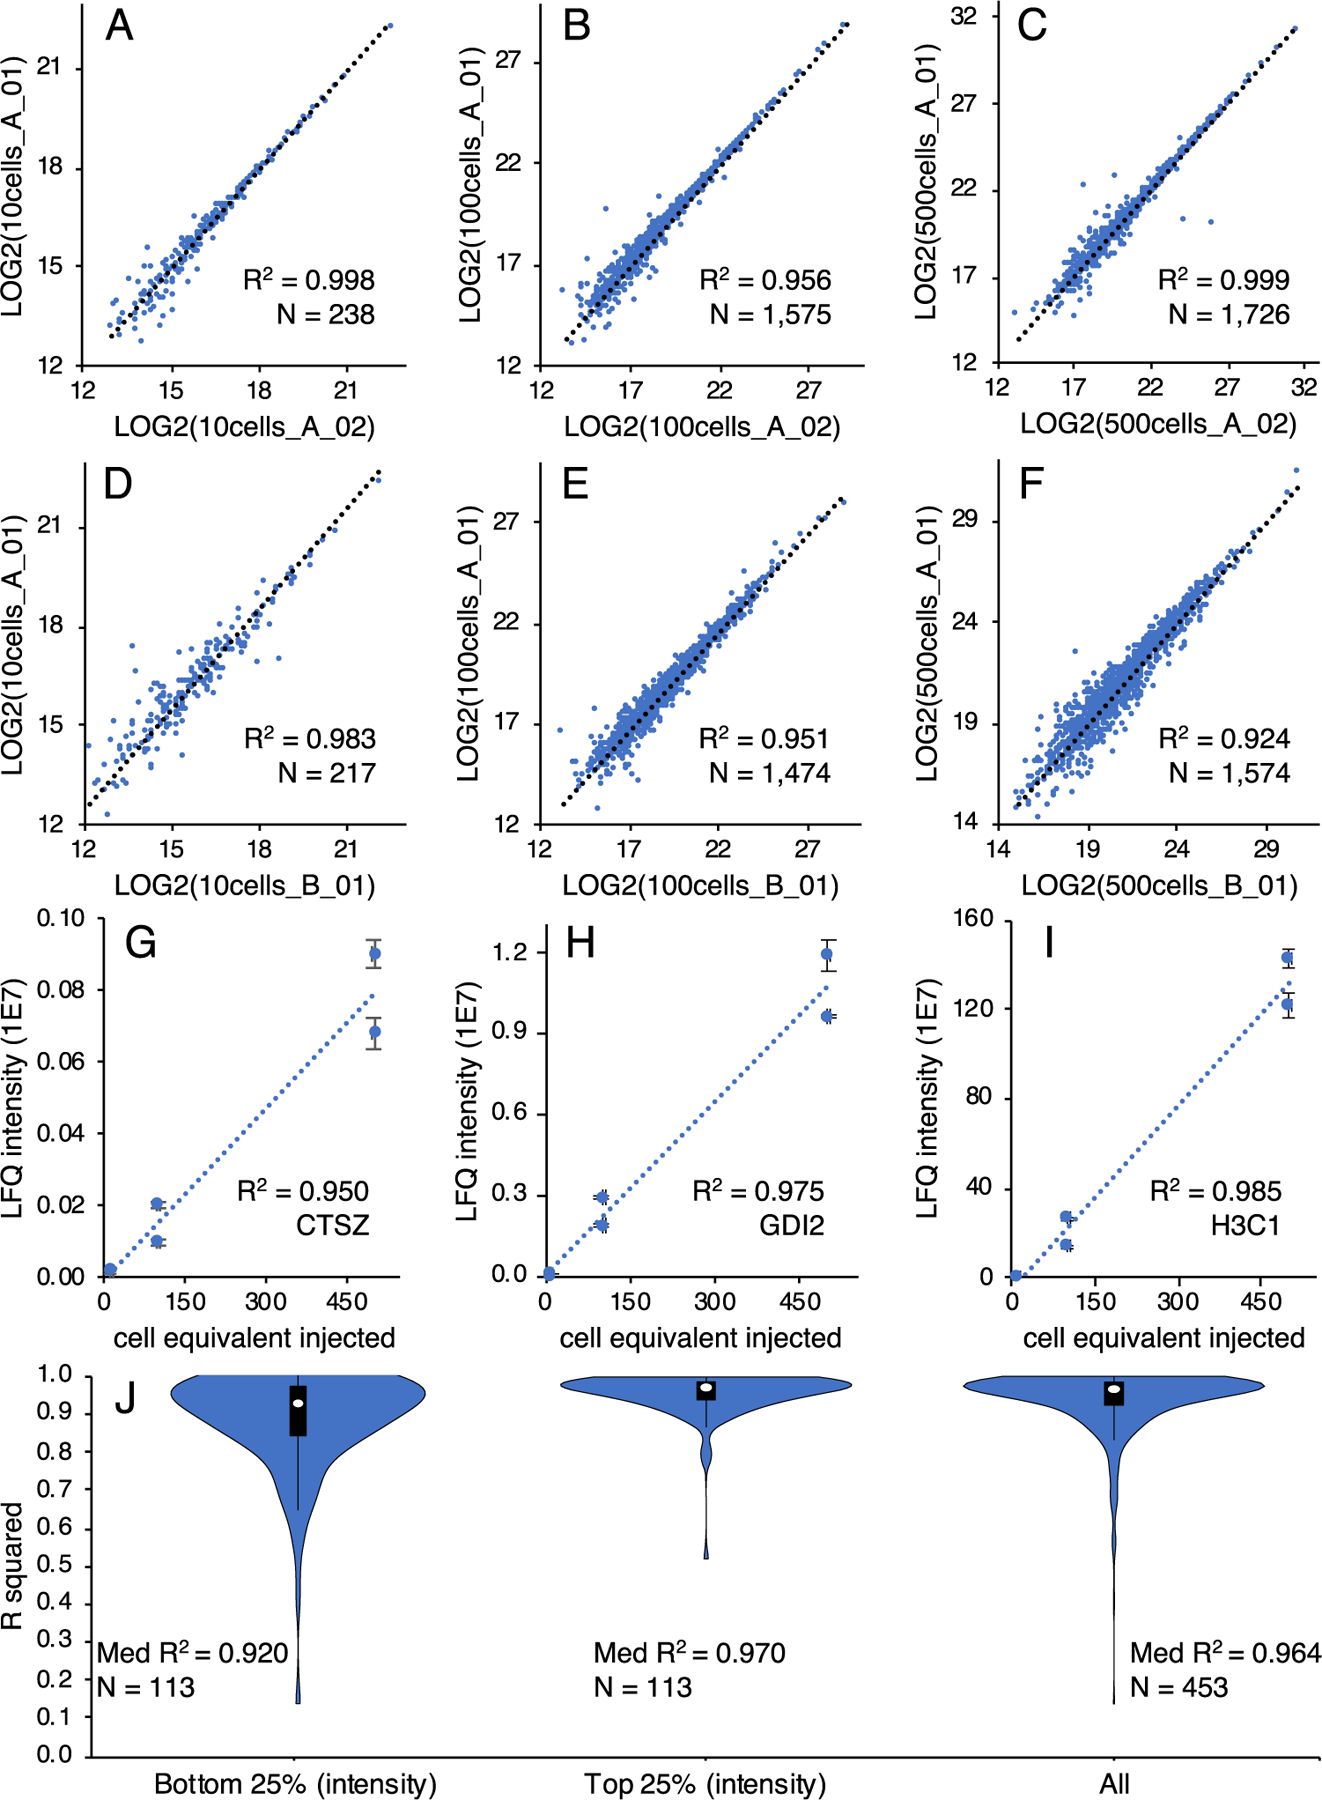
Comparison of label-free quantitation results from ~10, ~100, and ~500 U937 cells. Pairwise correlations of protein abundances for LC–MS runs of the same sample for aliquots equivalent to ~10 cells (A), ~100 cells (B), and ~500 cells (C). Pairwise correlations of protein abundances for LC–MS runs of different sample processing replicates for aliquots equivalent to ~10 cells (D), ~100 cells (E), and ~500 cells (F). Examples of low (G), medium (H), and high (I) abundance proteins from the comparison of protein abundances to the number of cells analyzed. Gene names are given for each protein example. Distribution of R2 values from the bottom 25%, top 25%, and all abundances for protein abundances compared to the number of cells analyzed (J). R2 values are given as mean ± SD.
