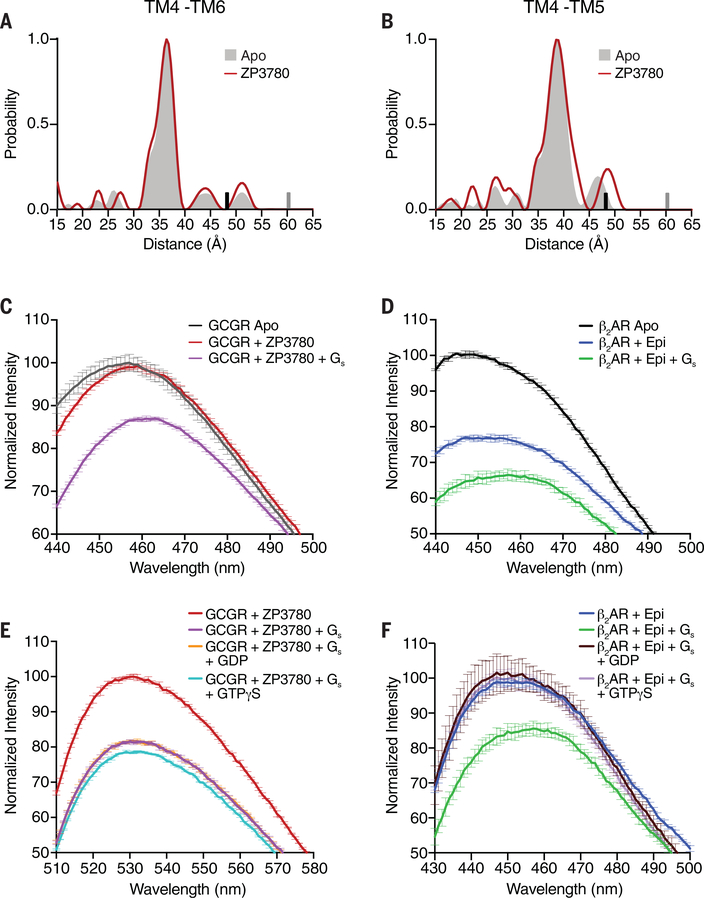
Fig. 6. Conformational changes in GCGR and β2AR upon ligand binding, G protein coupling, and G protein dissociation.
(A and B) DEER data showing no change in the distance distribution, between Apo (gray shading) and ZP3780 binding (red), of the TM4-TM6 and TM4-TM5 pairs. The upper limit of reliable distance (r) and width (σ) determination are shown as gray and black bars, respectively. (C) The apo (gray) spectrum of bimane-labeled GCGR (TM6) does not change upon ZP3780 addition (red). Further addition of Gs (purple) results in a decrease in fluorescence intensity and a 4-nm λmax shift owing to outward movement of TM6. (D) β2AR labeled with bimane in TM6 shows a decrease in fluorescence and a redshift in λmax when agonist, epinephrine (Epi) (blue), is added to apo (black), which changes further upon Gs (green) addition. (E) The addition of GDP (orange) or GTPγS (cyan) to NBD-labeled GCGR (TM6) bound to ZP3780 and coupled to Gs (purple) does not result in an increase of the fluorescence intensity to the level of ZP3780-bound GCGR in the absence of G protein (red). (F) The addition of GDP (brown) or GTPγS (light purple) to bimane-labeled β2AR bound to Epi and coupled to Gs (green) leads to an increase in fluorescence intensity and a blueshift in λmax to the same values as that for for Epi-bound β2AR in the absence of G protein (blue). In (C) to (F), data represent mean ± SEM of triplicate measurements.

