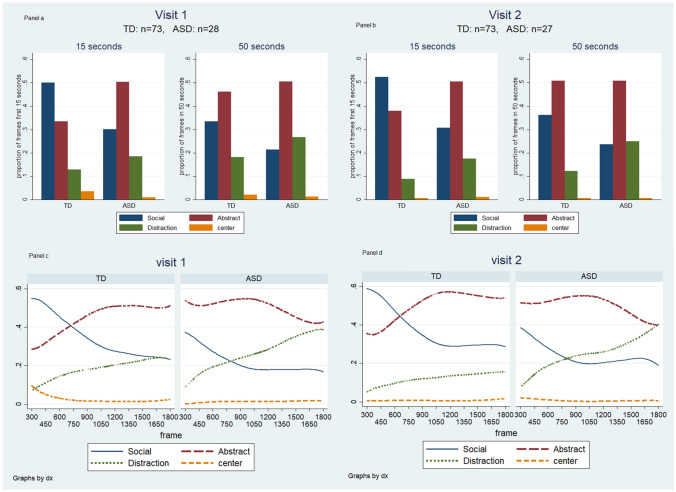
Fig. 1.
a and b: Focus areas of TD children and children with ASD during the first 15 s and the full 50 s at visit 1 a & visit 2 b. Each cluster of bars totals 100%. c and d: Focus trends among the two groups in the 50 s video in visit 1 c & visit 2 d. In c and d, LOWESS lines demonstrate the smoothed proportion of gaze at each scene by cases and controls at every ½ second of the video, depicting change in gaze direction as time elapsed over the duration of the video

