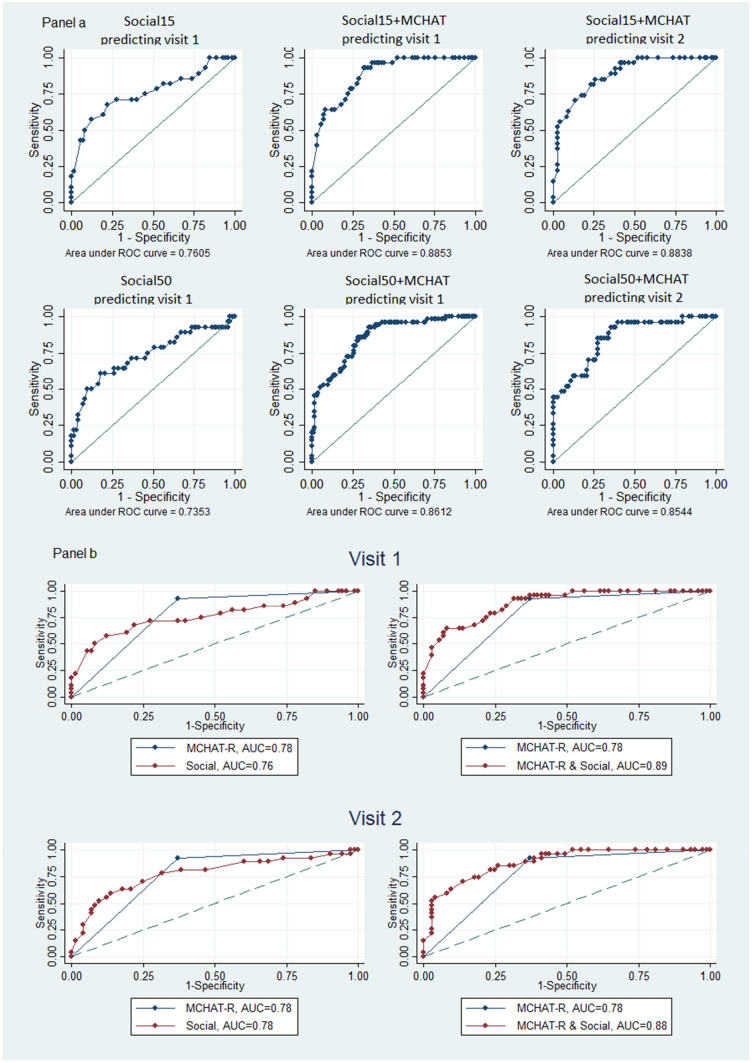
Fig. 3.
a ROC curves and AUC’s based on logistic models, first 15 s and the full 50 s. Models were developed using visit 1 data and were used to classify visit 1 and visit 2 data. Model predictors: Social15 represents the amount of time spent viewing the social scene during the first 15 s of the gaze preference data. Social50 represents the amount of time spent viewing the social scene during 50 s of the gaze-preference data. Social15 + MCHAT represents the amount of time spent viewing the social scene during the first 15 s and the MCHAT combined. b predictability of ASD based on attention to the social scene in the first 15 s alone, MCHAT-R alone or the GP-MCHAT-R model, compares the ROC curves and AUC values for the models based on the first 15 s. The left panels compare MCHAT-R against social scene (first 15 s) prediction. The right-side panels compare MCHAT-R against the 2-step model prediction

