
Fig. 4.
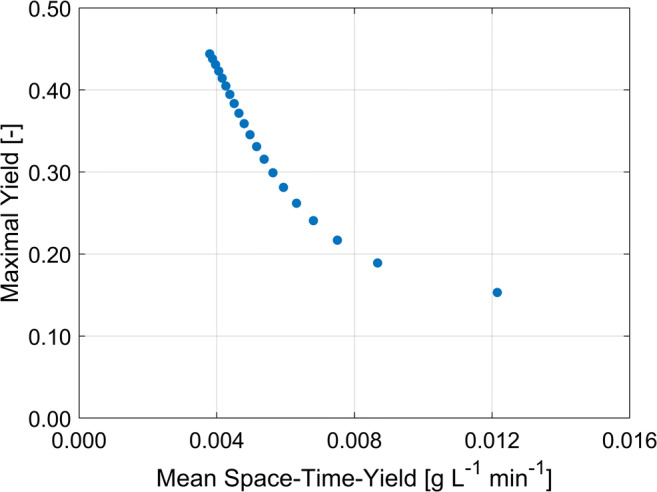
Pareto plot to illustrate the tradeoff of the maximal refolding yield against the mean space-time-yield during the fed-batch phase with 20 feed rates between 0.015 and 10 mL min−1 and otherwise equal conditions
Official websites use .gov
A
.gov website belongs to an official
government organization in the United States.
Secure .gov websites use HTTPS
A lock (
) or https:// means you've safely
connected to the .gov website. Share sensitive
information only on official, secure websites.
Pareto plot to illustrate the tradeoff of the maximal refolding yield against the mean space-time-yield during the fed-batch phase with 20 feed rates between 0.015 and 10 mL min−1 and otherwise equal conditions