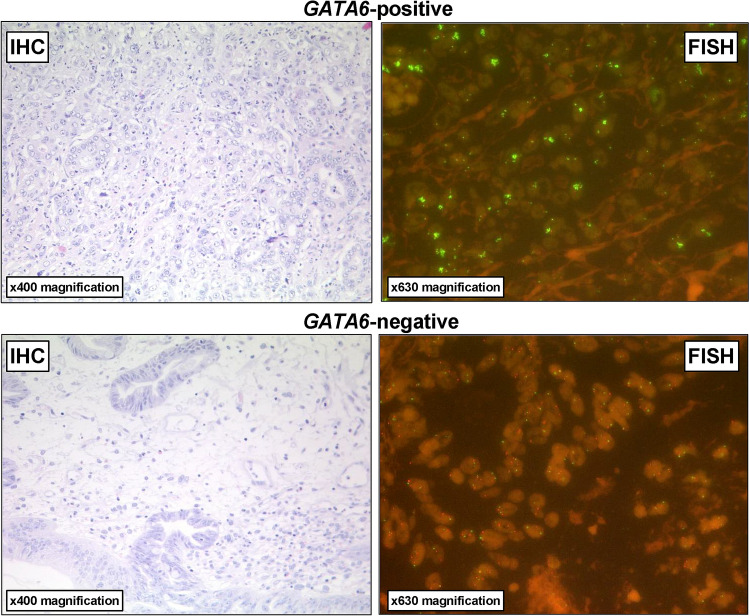
Fig. 1.
Representative images of immunohistochemistry (IHC) and fluorescence in-situ hybridization (FISH) analysis for the evaluation of GATA6 gene copy numbers using the GATA6-20-GR (green) and the Zytolight centromere 18 (CEN18) (red) Probe illustrating (upper row) GATA6-positive versus (lower row) GATA6-negative esophageal adenocarcinoma. GATA6 amplification was defined as gene copy cluster > 50% of the tumor cells, respectively, gene copy number > 6 per cell

