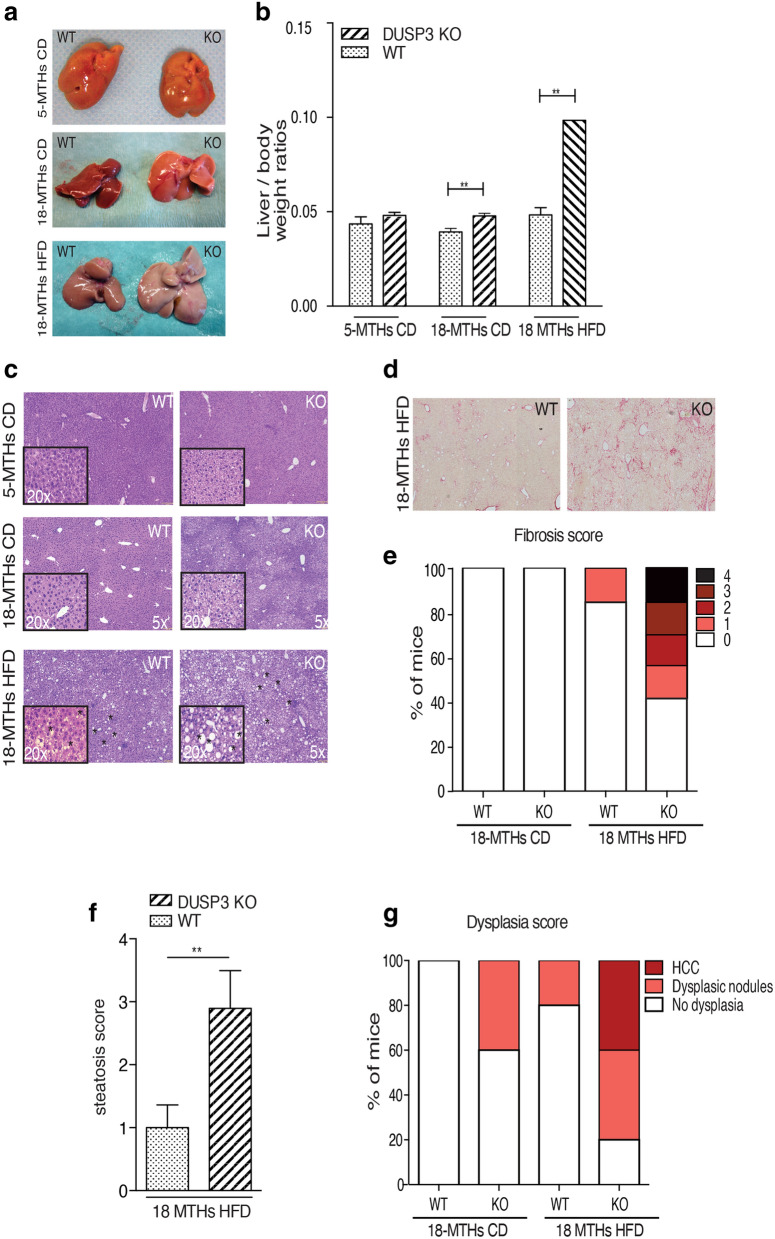
Figure 3.
DUSP3 deletion promotes NAFLD and associated liver damages. (a) Representative image of liver from mutant and WT mice fed CD or HFD. (b) Quantification of liver to body weight ratio. Data represent the mean ± SD of at least ten mice of each of the indicated group (**P < 0.01). (c) Representative images of H&E staining of liver sections from DUSP3-KO and WT fed CD or HFD. Asterisks indicate representative lipid droplets. (d) Representative images of Sirius Red staining of liver sections from DUSP3-KO and WT fed HFD. (e–g) Fibrosis (e), steatosis (f) and dysplasia (g) scores. Mean ± SD values for all mice are shown. *P < 0.05; **P < 0.01.

