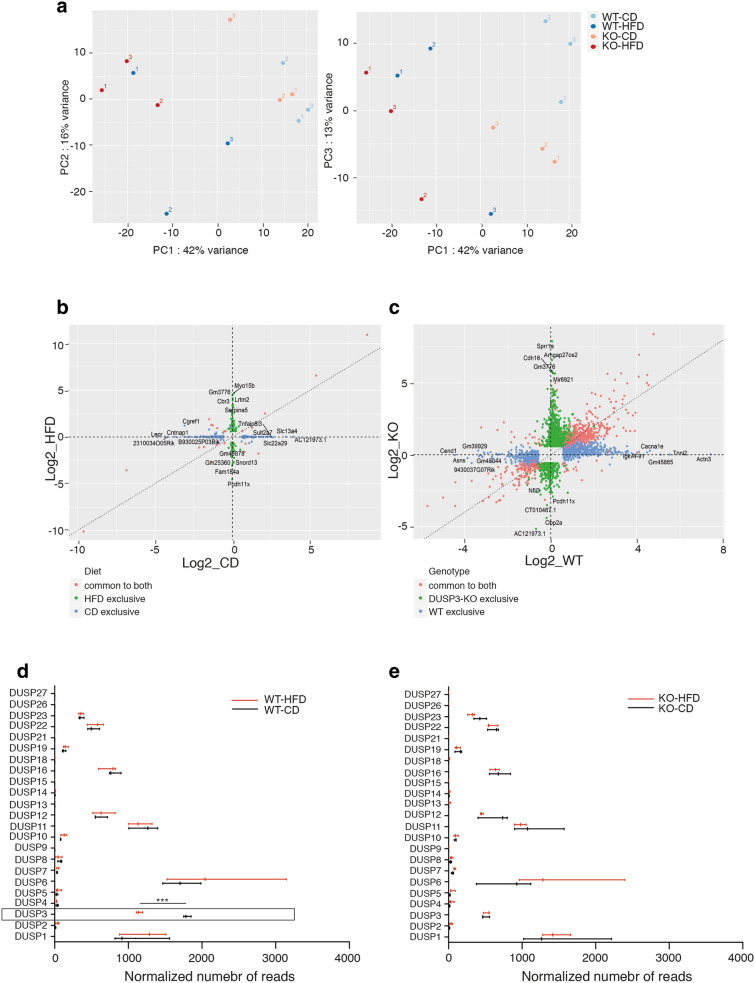
Figure 8.
RNAseq analysis of DUSP3-KO and WT mice livers under CD and HFD. (a) Principal component analysis (PCA) on DUSP3-KO mice livers under CD (orange dots), or HFD (red dots) and WT mice livers under CD (light blue dots) or HFD (dark blue dots). (b,c) Comparison of the fold change difference between WT and DUSP3-KO genotypes for CD and HFD (b) and between CD and HFD for WT and the DUSP3-KO (c). Genes with adjusted p-value < 0.05 and fold change > 1.5 in at least one genotype were plotted. (b) Genes exclusive to CD are blue, the ones exclusive to HFD are green and the ones in common to both are red. (c) Genes exclusive to WT are blue, the ones exclusive to DUSP3-KO are green and the ones in common to both are red. Genes with the 5 highest or lowest fold changes in each group are labeled. (d,e) Comparison of expression levels of all known DUSPs in WT and DUSP3-KO (KO) mice under CD and HFD. Data are shown as normalized number of reads for each individual gene. ***P < 0.001.

