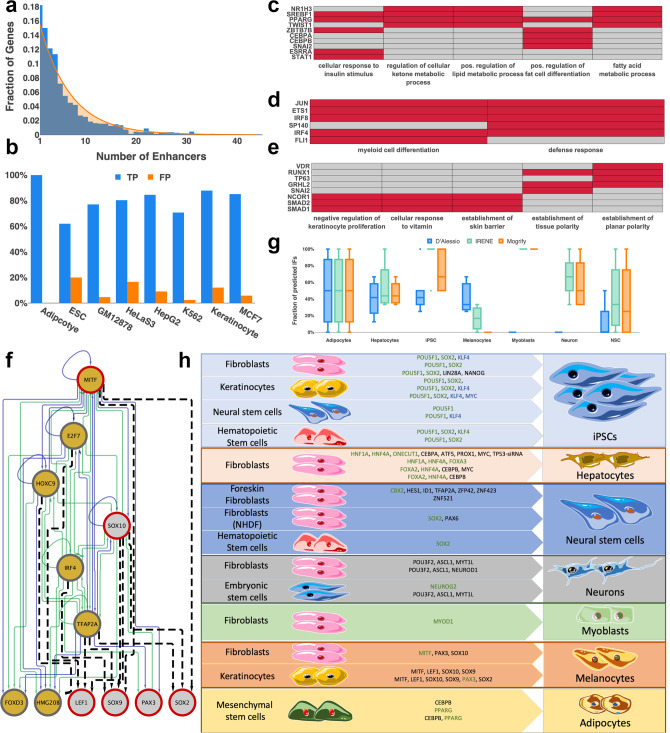
Fig. 1. Benchmarking of IRENE.
a The number of enhancers per gene (blue) across all networks follows an exponential distribution (orange). b Benchmark of reconstructed networks against cell-type-specific TF ChIP-Seq data for 8 cell types/cell lines. True positives (TP, blue) represent the interactions that are present in the reconstructed GRNs and are experimentally validated by cell-type-specific TF ChIP-Seq data. Interactions validated by TF ChIP-Seq data only profiled in cell-types other than the one under consideration are considered false positives (FP, orange). n = 13 (Adipocyte), 69 (ESC), 236 (GM12878), 238 (HeLaS3), 292 (HepG2), 53 (K562), 37 (Keratinocyte) and 178 (MCF7) interactions. c–e Most-highly enriched significant gene ontology terms for the reconstructed networks of c adipocytes, d natural killer cells and e mammary epithelial cells. For adipocytes and mammary epithelial cells, the top 5 GO terms are represented. For natural killer cells, only two terms were significantly enriched. Cells corresponding to TFs that are and are not relevant for a particular GO term are colored in red and gray, respectively. f Reconstructed melanocyte subnetwork including all experimentally validated (red border) and predicted IFs (gold) for the conversion of fibroblasts towards melanocytes. Enhancer and promoter regulation (green) is distinguished from enhancer-only regulation (blue). Predicted interactions from position weight matrices using Homer are depicted as black dashed lines. g Recovery of experimentally validated IFs in seven target cell types using IRENE (green), Mogrify (orange), and the method from d’Alessio et al. (blue). The fraction of recovered IFs in multiple combinations of cellular conversions is depicted as box plots. The median is represented by a solid line within the boxes. The lower and upper bounds of boxes are the first and third quartile, respectively. Whiskers extend to 1.5-times the interquartile range or the minimum/maximum value. Dots correspond to outliers. n = 3 (Adipocytes), 4 (Hepatocytes), 10 (iPSC), 3 (Melanocytes), 1 (Myoblasts), 4 (Neuron), and 4 (NSC) combinations of cellular conversion factors. h Enrichment of predicted instructive factors in experimentally validated IF combinations. Predicted IFs are highlighted in green whereas TFs that were replaced by another validated and more efficient IF are highlighted in blue. TFs not predicted by IRENE are colored in black.

