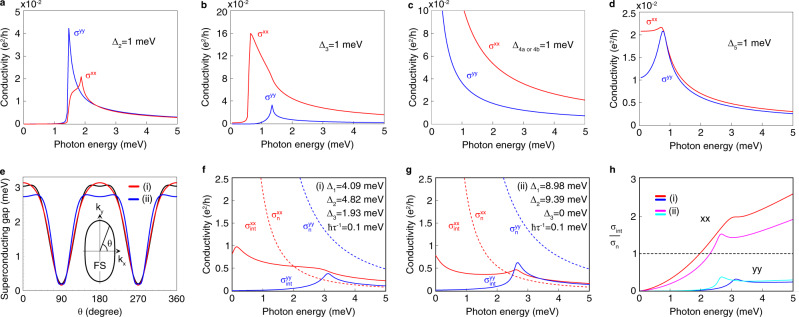
Fig. 3. Optical conductivity in a model of superconducting FeSe near Γ at zero temperature.
Model parameters in the normal state are adapted from ref. 39 (see section 6 in the Methods). The xx and yy components of the conductivity tensor is shown in red and blue, respectively, in (a–d, f, g). a–d Nonzero intrinsic optical conductivity tensors for each constant pairing function. See Methods and Table 2 for the matrix form and symmetries of the six constant pairing functions Δ1–Δ4a, Δ4b, and Δ5. The case of the Δ1 pairing is not shown as the conductivity is identically zero. e Superconducting gap similar to the experimentally observed gap. FS and the ellipse enclosing it represent the Fermi surface. Red and blue curves correspond to the choice of pairing functions (i) Δ1 = 4.09 meV, Δ2 = 4.82 meV, and Δ3 = 1.93 meV or (ii) Δ1 = 8.98 meV, Δ2 = 9.39 meV, and Δ3 = 0 meV, respectively. They are least-square fits with and without Δ3 to (shown as a black curve) that was obtained in ref. 15 from experimental data. f, g Conductivity with pairing functions used in (e). σint is the internal optical conductivity in the superconducting state (solid lines), and σn is the Drude conductivity in the normal state (dashed lines). The disorder-mediated conductivity in the superconducting state is expected to be comparable to σn. h Ratio of σint and σn. Red and blue curves are for parameters in (f), and magenta and cyan are for parameters in (g). xx and yy indicate the component of the conductivity tensor. σxy and σyx are not shown in all plots because they vanish due to Mx symmetry.

