
Fig. 5. Expression and localisation of PfCK2α-GFP during gametocytogenesis (stage I–V) by live cell fluorescence imaging.
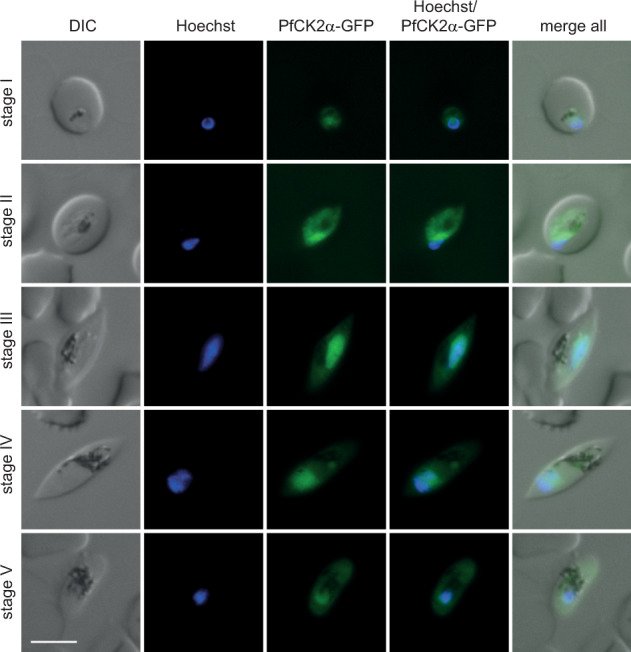
Representative images are shown. Nuclei were stained with Hoechst. DIC, differential interference contrast. Scale bar = 5 µm.
Official websites use .gov
A
.gov website belongs to an official
government organization in the United States.
Secure .gov websites use HTTPS
A lock (
) or https:// means you've safely
connected to the .gov website. Share sensitive
information only on official, secure websites.
Representative images are shown. Nuclei were stained with Hoechst. DIC, differential interference contrast. Scale bar = 5 µm.