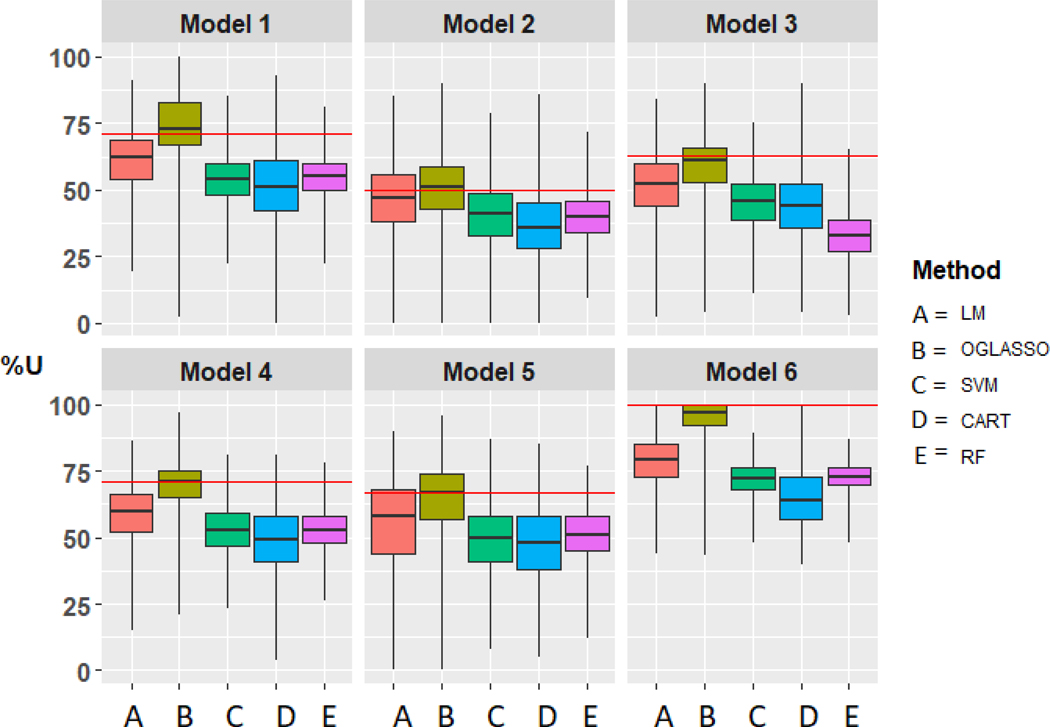
Figure 3:
Comparison of the Linear Model (LM), Overlapping Group LASSO (OGLASSO), Support Vector Machines (SVM), Classification and Regression Trees (CART) and Random Forests (RF) for subgroup estimation in a clinical trial with 400 subjects with four biomarkers using box plots for the distribution of %U. Horizontal line represents %U in all subjects.

