
Figure 2, Key Figure. Comparison and contrast between select essential pathways across parasites as determined by enrichment analyses of each essentiality category.
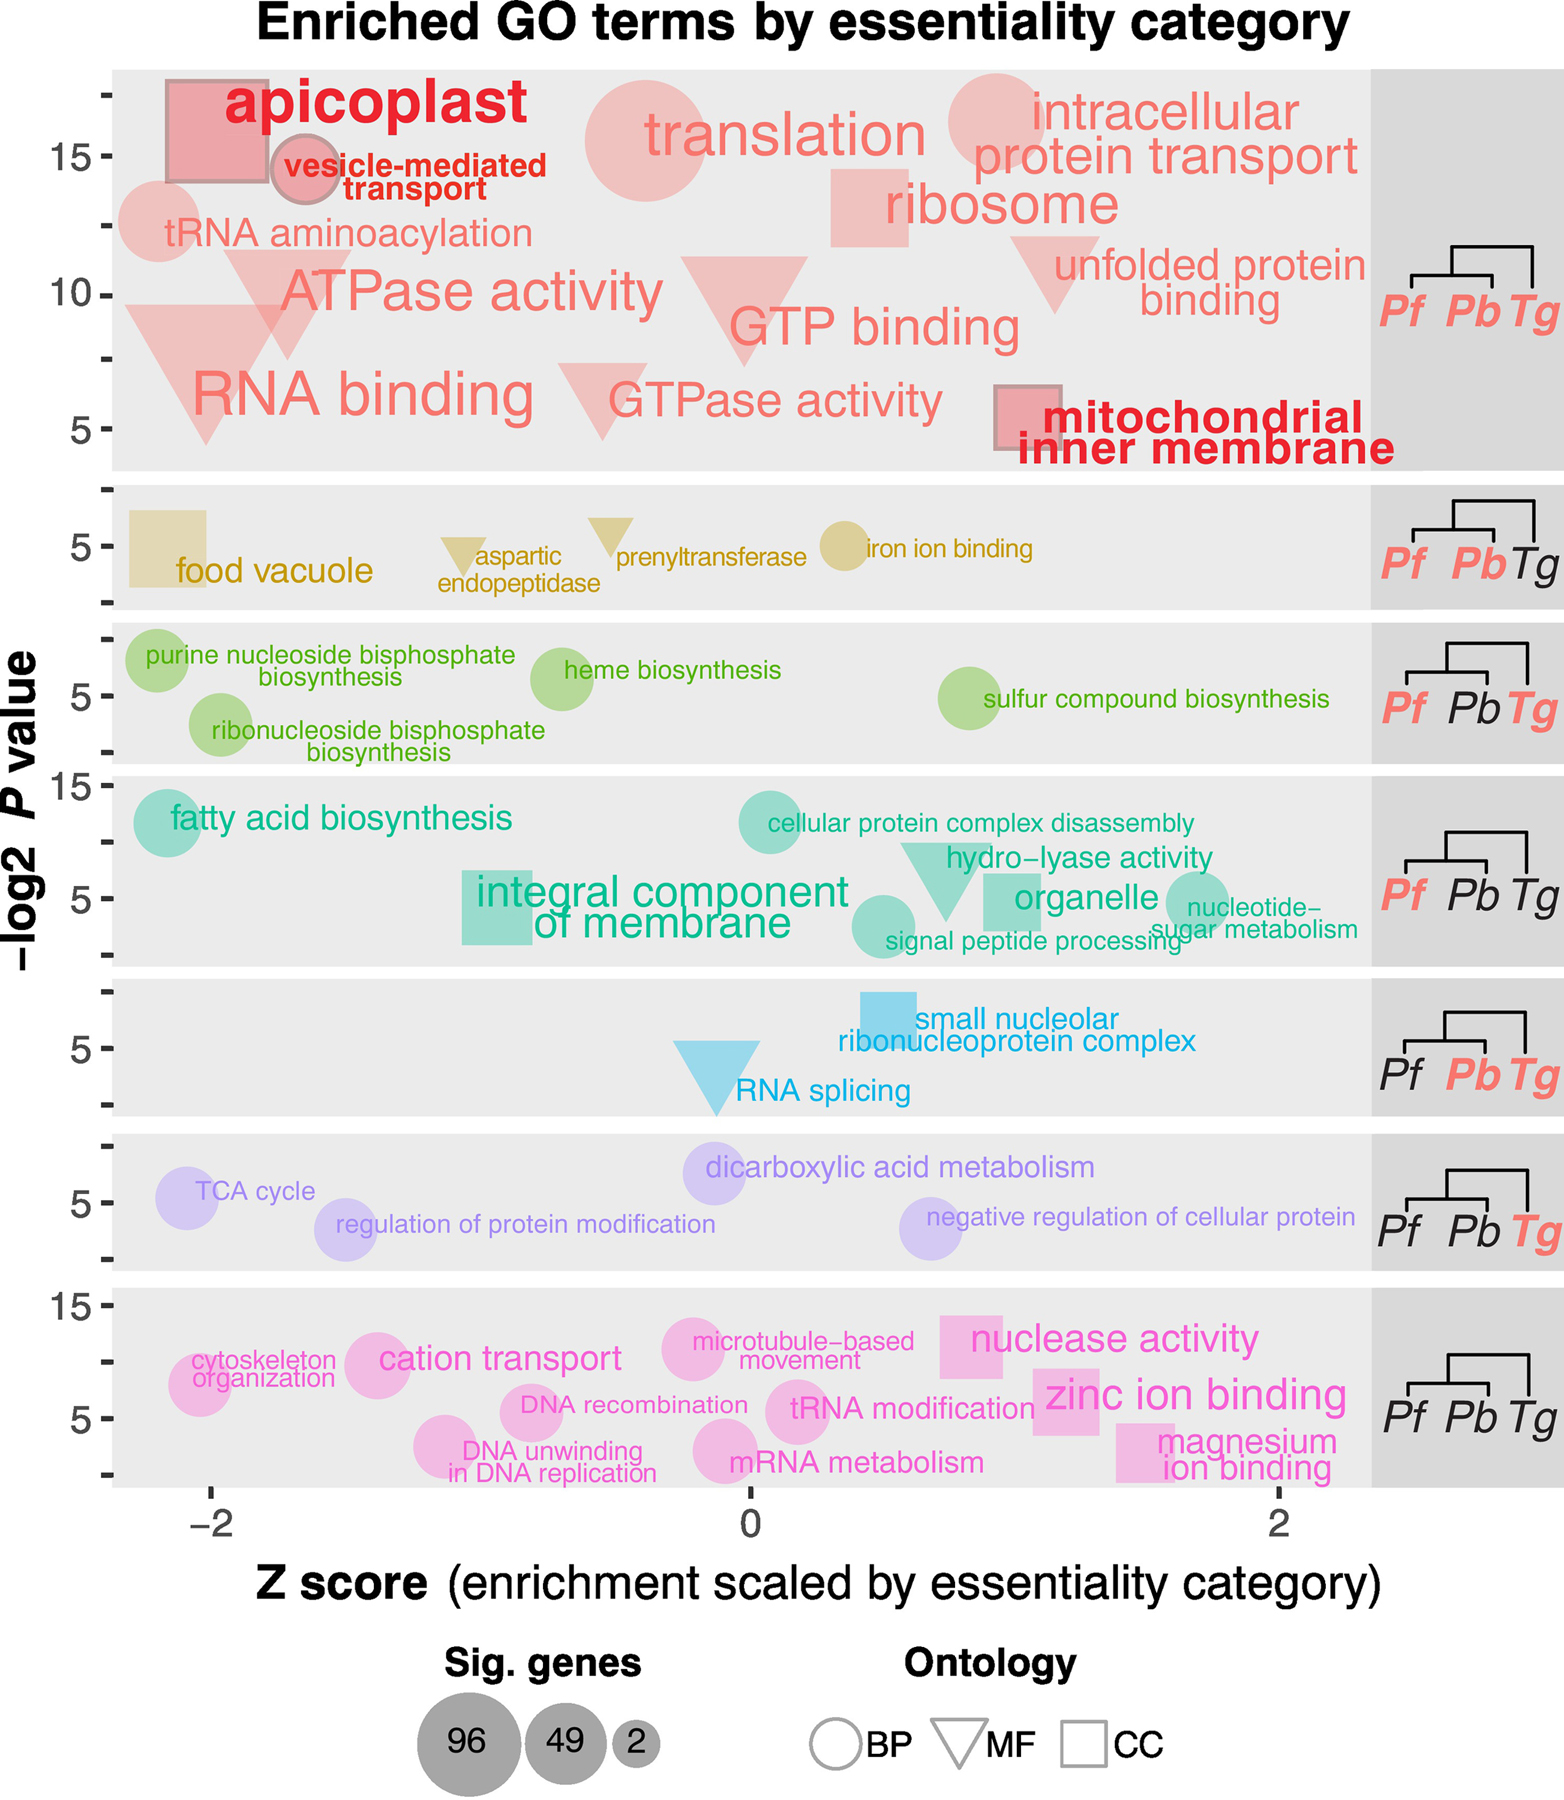
Cladograms on the right indicate each essentiality category, where orange indicates essentiality and black indicates dispensability for the given species. The y-axis (-log2 p-value) describes the absolute significance of a term’s enrichment, and the x-axis (Z-score) describes the significance of each term compared to every other significant term in that essentiality category. The upper left quadrant of each category indicates highest significance (lowest Z-score and highest –log2 p-value (weighted Fisher/elim hybrid test)). Only significant terms (p-value <=0.05) are plotted. Coordinates are approximate (points are staggered randomly for ease of viewing). Font-size and point-size indicate the number of significant genes in the essentiality category mapping to that GO-term. Expected highly conserved categories such as translation-associated terms are highly essential across all three parasites, as are terms related to endosymbiont-derived organelles (highlighted in red). BP: biological process. CC: cellular component. MF: molecular function.