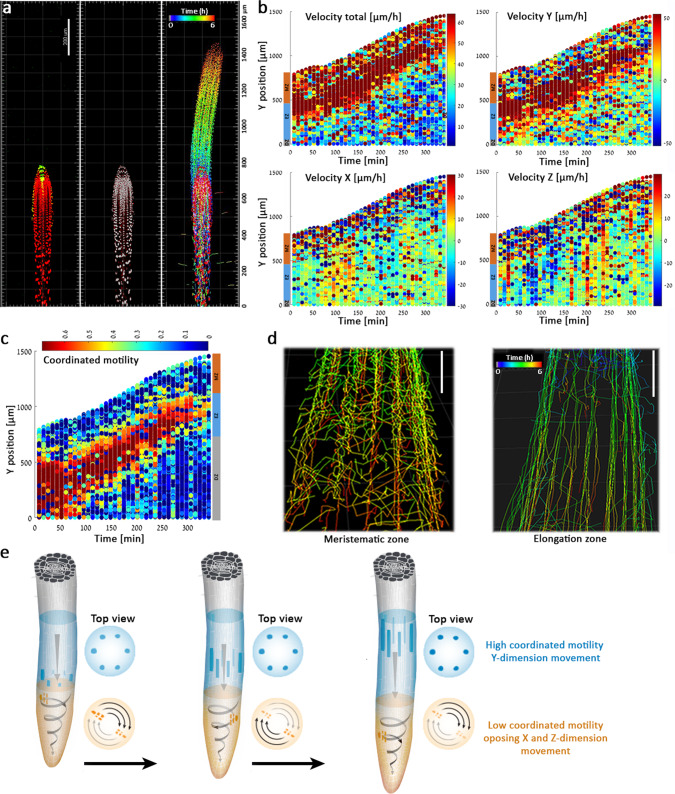
Fig. 2. Single-cell tracking approach quantitatively reports on root growth and skewing.
a Left: pWOX5:XVE:YUC1-TAA1; DR5:VENUS roots without estradiol treatment (control) were imaged in 3D over time. Red: 35S:H2B-RFP (marking nuclei); green: DR5:VENUS. Middle: Single-nuclei image analysis detection; each nucleus is indicated by a gray dot. Right: Tracking of individual nuclei over time and space. Time is indicated by the rainbow scale (0–6 h). The experiment was independently repeated three times. Scale bar = 200 μm. b Velocity maps over time. Root tip is positioned upwards. On the color scale on the right, high velocity is red; low velocity is blue. The color scale on the left indicates developmental stages (MZ meristem zone, EZ elongation zone, DZ differentiation zone). c Coordinated motility over time. On the color scale on the top, red indicates strong coordination; blue indicates no coordination. The color scale on the right indicates developmental stages (MZ meristem zone, EZ elongation zone, DZ differentiation zone). d Single-nuclei tracking routes of cells positioned at the meristem (left) and elongation (right) zones. Meristematic zone tracking shows opposing vectorial motion of cells positioned in opposite sides of the root diameter. T0 is 20 min following estradiol treatment; rainbow scale indicates time (0–6 h). The experiment and analysis were independently repeated three times. Scale bars = 50 μm. e Schematic representation of root skewing and coordinated motility in the elongation and meristem zones. In the elongation zone (blue), cells move primarily in the Y-dimension, therefore showing high coordinated motility. The skewing of the meristem zone (orange) generates motion in X, Y, and Z-dimensions. Cells positioned on opposing sides of the root meristem move in opposite directions, therefore showing low coordinated motility.

