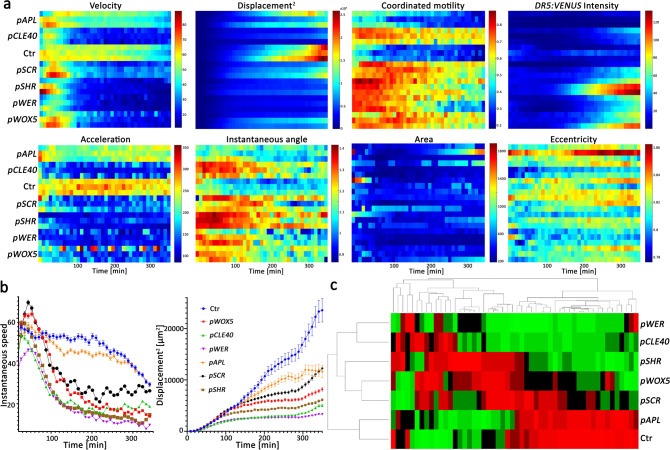
Fig. 3. Root kinetics in response to cell-type-specific IAA induction.
a Heat maps of 8 root kinetic and morphologic parameters in response to cell-type-specific auxin production. Red indicates high and blue indicates low values. The data are average values for the different parameters collected from all root nuclei over time including meristem, elongation, and differentiation zones. Data were concatenated from three independent root movies for each line, each with ~1000 nuclei. b Instantaneous speed and cell displacement over time for the indicated lines. Shown are means (±SD), n ≥ 300. c Hierarchical clustergram analysis of the indicated lines grouped by morphokinetic parameters. Ctr indicates control mock-treated pWOX5:XVE:YUC1-TAA1; DR5:VENUS seedlings. For complete list of all parameters see Supplementary Table 1 and Supplementary Fig. 9. Data were concatenated from three independent root movies for each line, each with ~1000 nuclei. The n number for each line and time point is indicated at Source data file. T0 is 20 min following 5 μM estradiol treatment.

