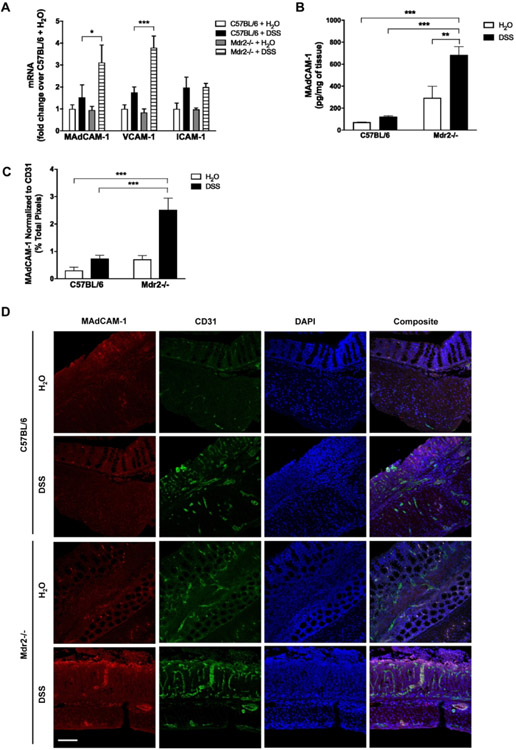
Figure 3. Colonic expression of adhesion molecules in DSS-treated WT and Mdr2−/− mice.
WT and Mdr2−/− mice were subjected to DSS treatment as described in Fig. 2. (A) Real-time quantitative PCR (qPCR) analysis of colon tissue (B) ELISA measurement of colonic MAdCAM-1 protein. (C, D) Representative immunofluorescence double staining of MAdCAM-1 (red; Alexa Fluor 555) and CD31 (green; Alexa Fluor 488) on colon tissue (100X) shown in panel D. Quantitation of MAdCAM-1 density normalized to CD3 is shown in panel C. n ≥ 5 mice per group. Data are expressed as means ± SEM. *P<0.05, ***P<0.001, two-way ANOVA.

