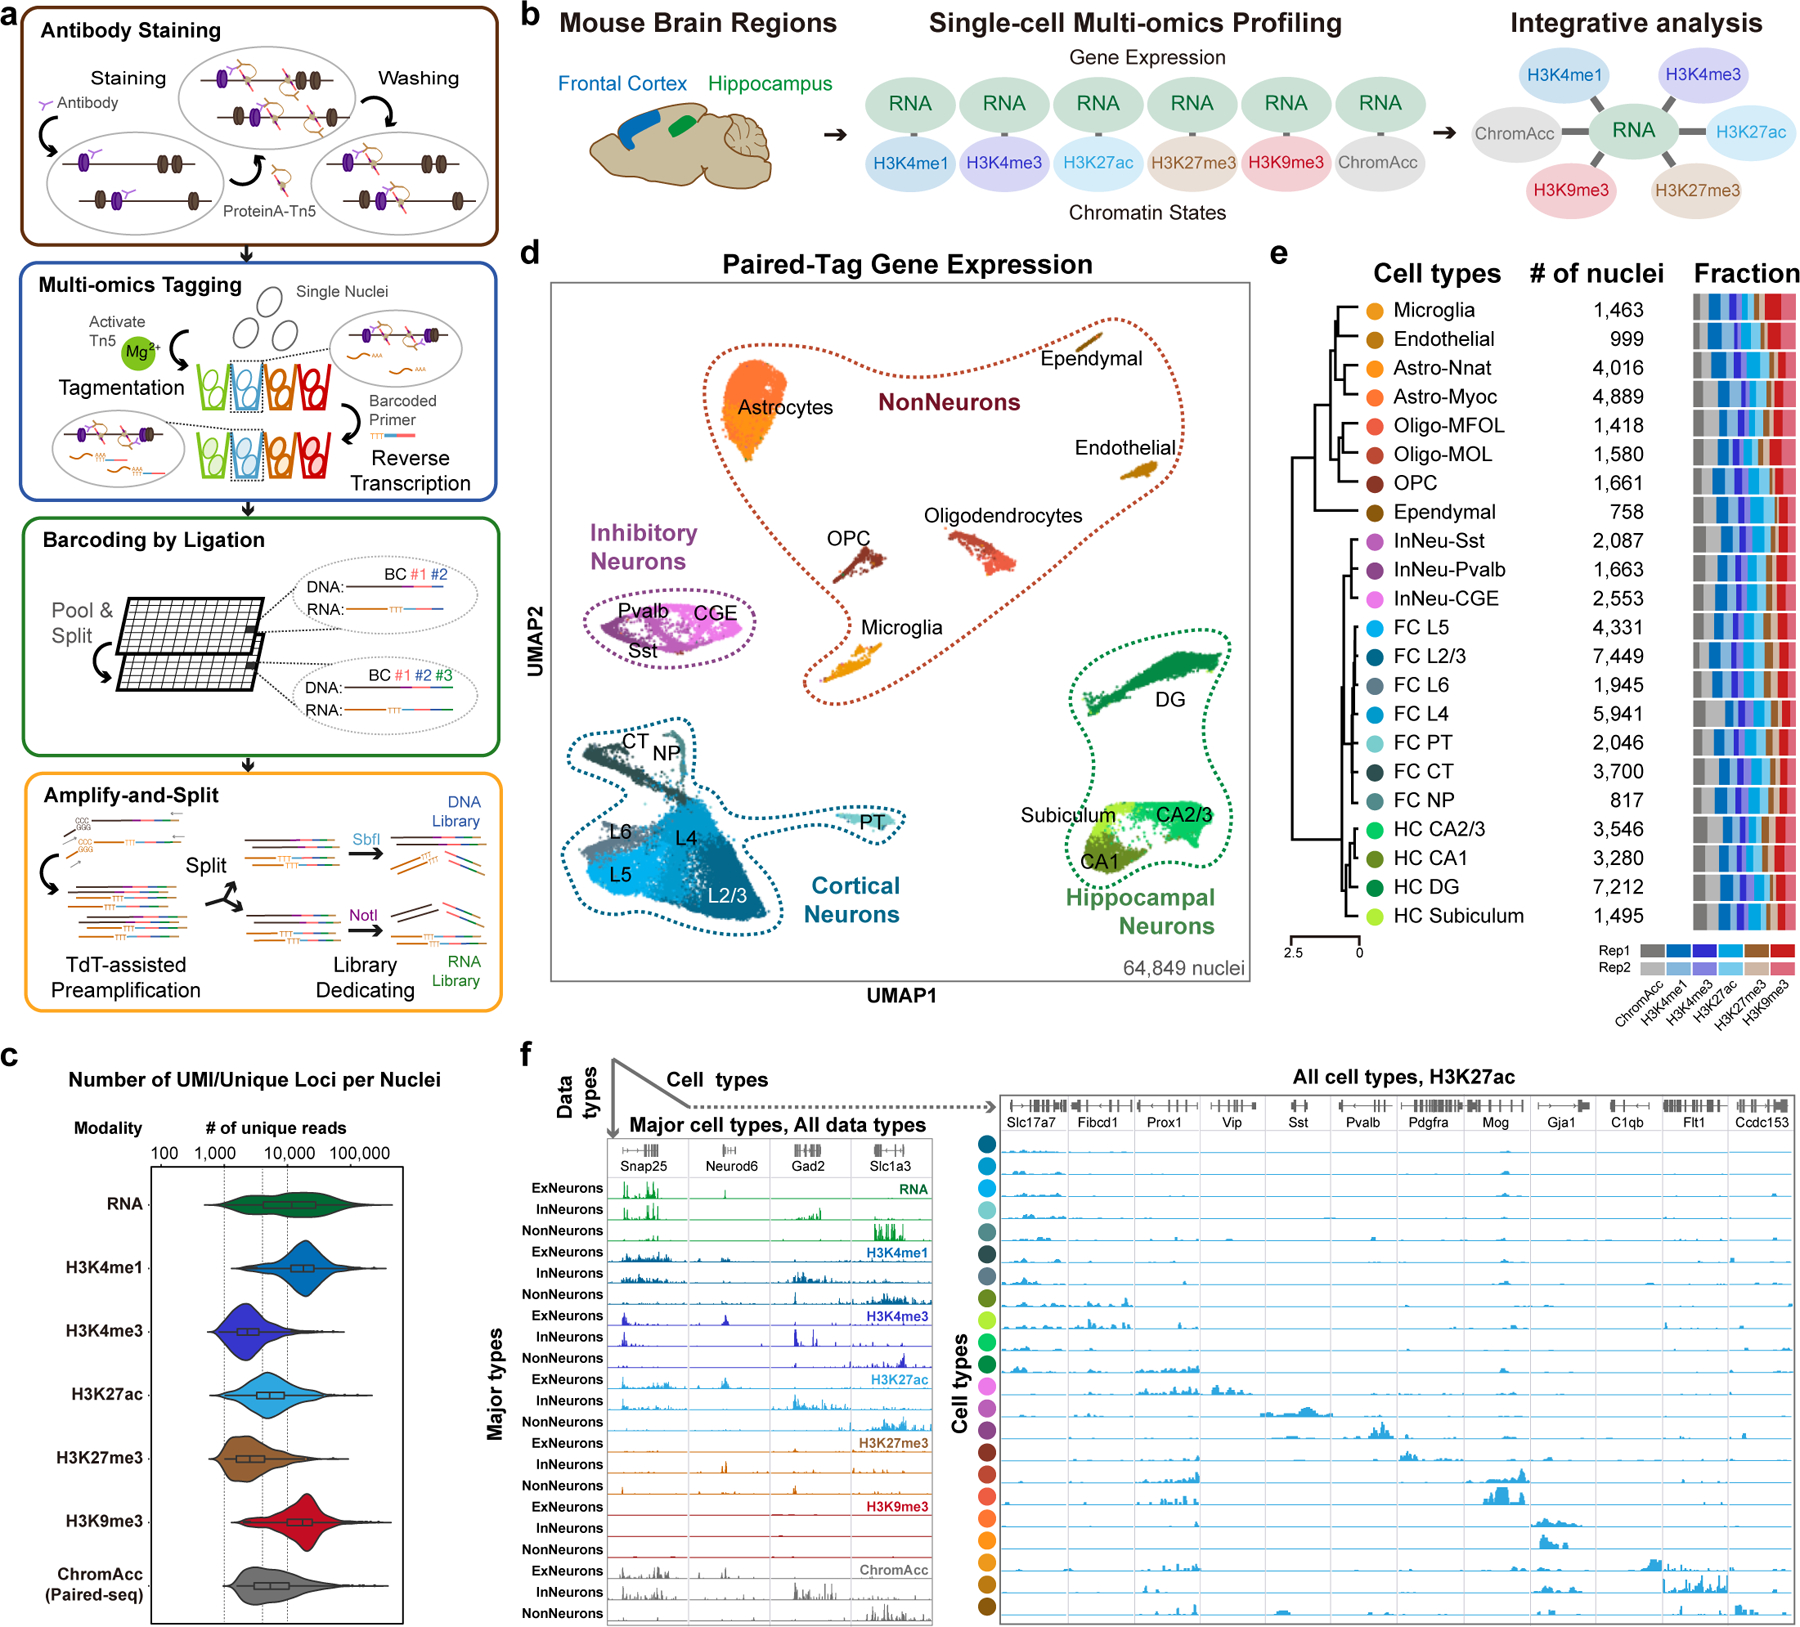
Fig. 1 |. Overview of Paired-Tag.

a, Schematic of Paired-Tag workflow. b, Single-cell, joint analysis of histone modifications and transcriptome in adult mouse frontal cortex and hippocampus. Paired-Tag assays were performed with antibodies against H3K4me1, H3K27ac, H3K27me3 or H3K9me3. Paired-seq assay was also performed with the same tissue samples (ChromAcc: chromatin accessibilities). The transcriptomic profiles from each paired dataset were then used to annotate each cell cluster. c, Violin plots showing the unique loci (DNA) or UMI (RNA) per nuclei of representative deeply sequenced Paired-Tag and Paired-seq datasets. The violin plots were drawn from lower quartile (Q1) to upper quartile (Q3) with the middle line denote the median, whiskers with maximum 1.5 IQR, outliers were indicated with dots. n= 1,651 (RNA), 865 (H3K4me1), 1,002 (H3K4me3), 786 (H3K27ac), 558 (H3K27me3), 1,054 (H3K9me3) and 2,472 (ChromAcc) cells from dissections of 2 different mice. d, UMAP embedding showing the clustering of single nuclei from Paired-Tag and Paired-seq transcriptomic profiles. Each dot represents an individual nucleus profiled by Paired-Tag and Paired-seq and was colored according to the assigned cell cluster according to (e). e, Numbers of nuclei from the 22 mouse brain cell types and the fraction of nuclei from each replicate. Cell clusters were annotated based on marker genes expression. PT: pyramidal tract excitory neurons; CT: corticothalamic excitatory neurons; NP: near projecting excitatory neurons. f, Representative genome browser views of aggregated single-nuclei transcriptomic and the matched epigenetic profiles.
