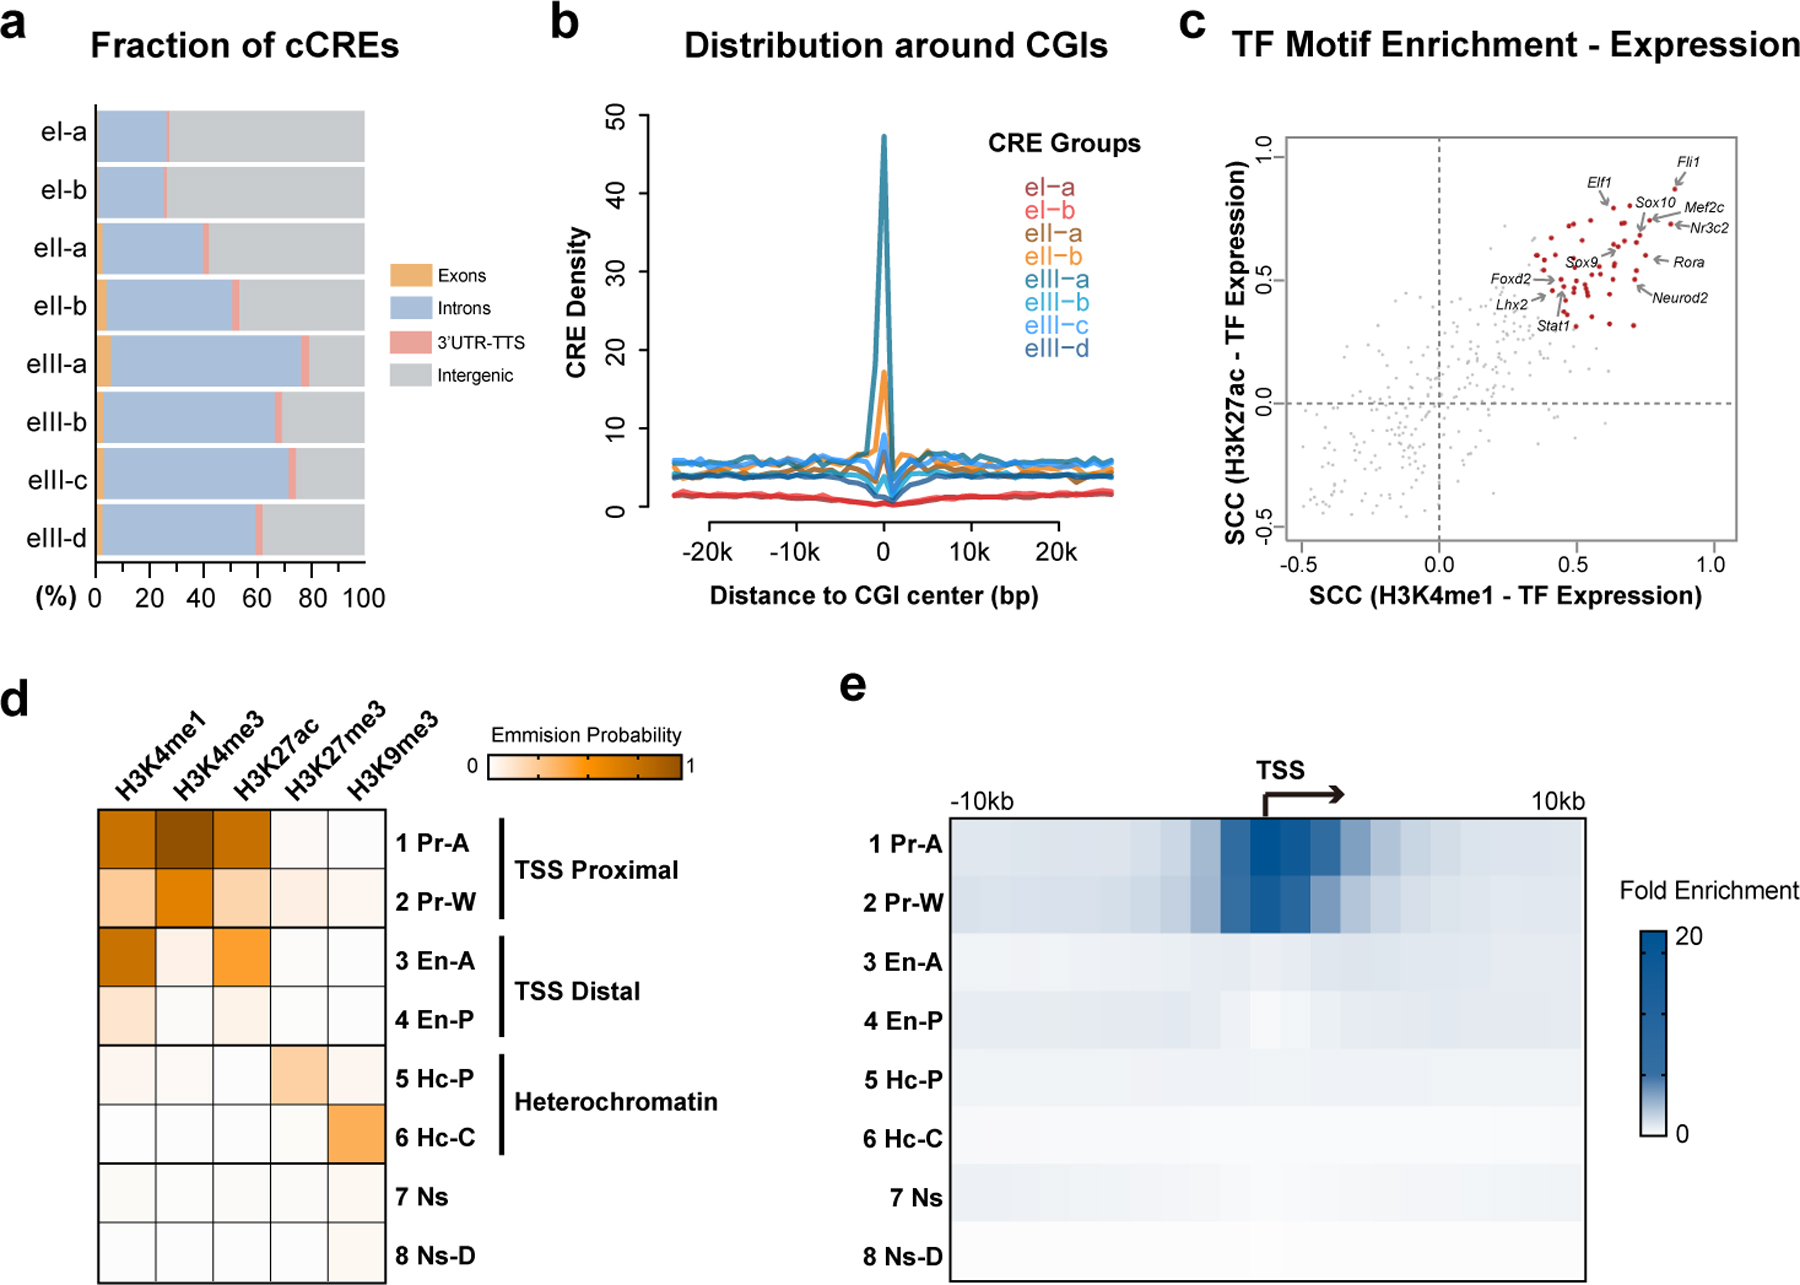
Extended Data Fig. 6. Histone modification states in mouse neuron cell types.

a, Stacked bar plots showing the fraction of genomic regions for CREs of each group in Fig. 4a and b. b, Line plots showing the densities of CREs from different groups around CpG islands. c, Scatter plot showing the Spearman’s correlation coefficients of TF motif enrichment and TF gene expression across cell types. TFs with significant positive correlations (FDR < 0.05) between expression and motif enrichment for both H3K4me1 and H3K27ac were colored in red. d, Heatmap showing the emission probability of each histone mark across the 8 chromatin states identified by chromHMM. e, Heatmap showing the fold enrichment of the 8 chromatin states around transcription start sites of FC L2/3 cell cluster.
