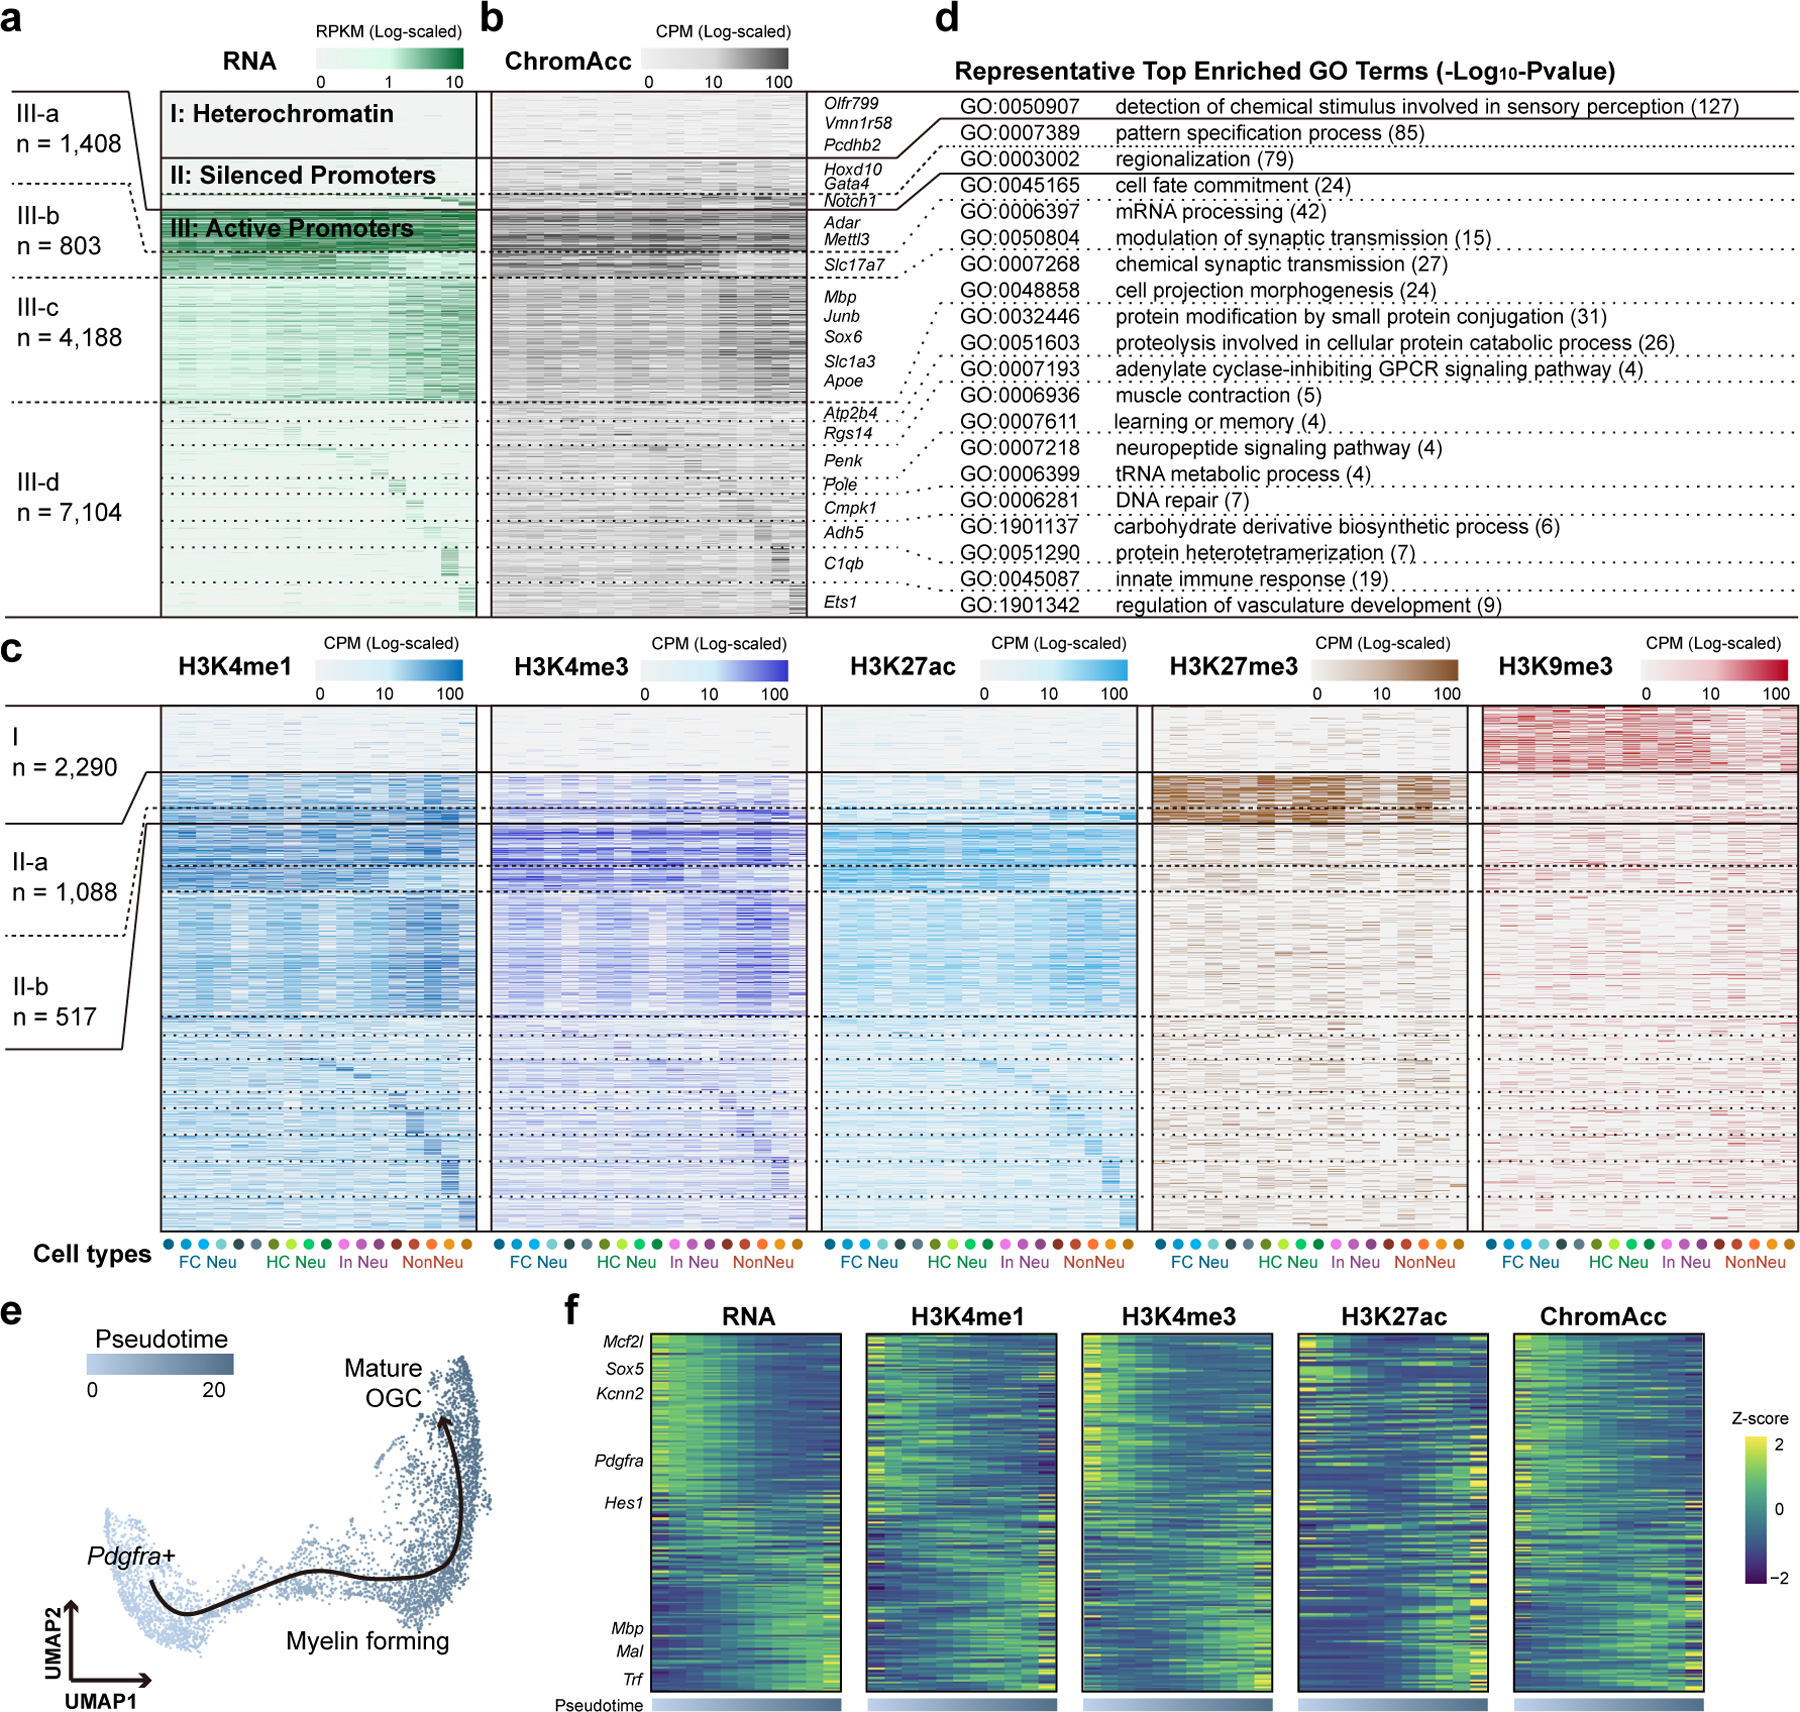
Fig. 3 |. Integrative analysis of chromatin states at promoters and gene expression across mouse brain cell types.

a, Heatmap showing the (a) transcript levels of genes with detected matched histone modification profiles for each mouse brain cell type. Cell types were indicated with colored dots below and the color of the dots are the same as in Fig. 1d. b, c, Heatmaps showing the matched (b) chromatin accessibility and (c) histone modification levels for the promoters of corresponding genes in (a). Genes were grouped using K-means clustering based on both expression and histone modification levels of H3K27ac, H3K27me3 and H3K9me3. c, Top enriched GO terms for genes in each category of (a). e, UMAP embedding showing the trajectory of oligodendrocyte maturation. Each dot represents a single nucleus and colored by pseudotime. f, Heatmaps showing the gene expression levels, promoter histone modification levels and promoter chromatin accessibility of differentially expressed genes along the pseudotime.
