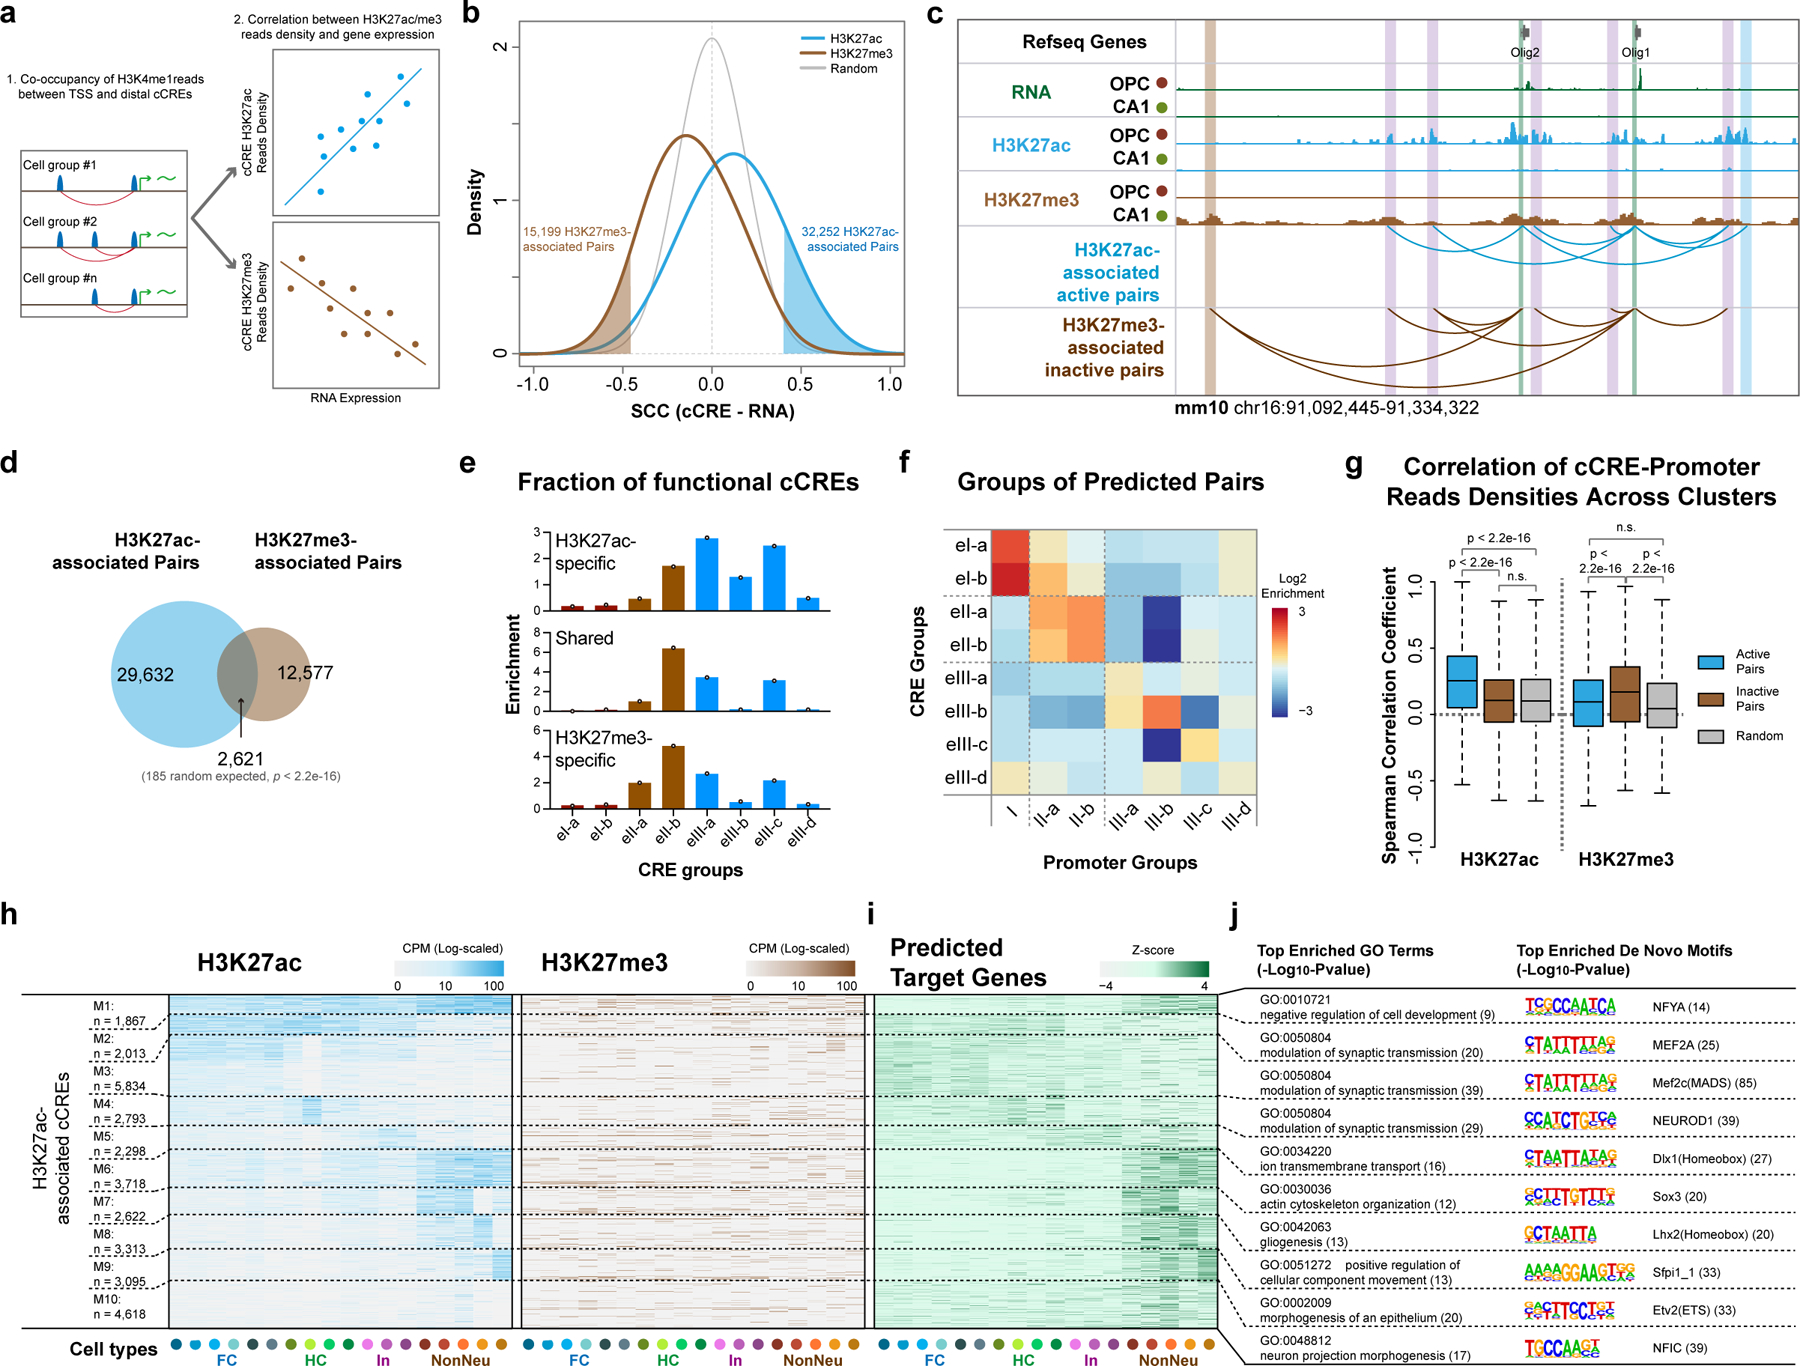
Fig. 5 |. Correlative analysis of chromatin state and gene expression links distal candidate cis-regulatory elements to putative target genes.

a, Schematics for identifying potential targets for cCREs. Putative cCRE-gene pairs were first determined by calculating the co-occupancy of H3K4me1 reads in gene promoter and distal cCRE regions. The Spearman’s Correlation Coefficients between expression levels of genes and H3K27ac or H3K27me3 levels of cCREs were then used to identify cCRE-gene pairs. b, Density plot showing the distribution of correlations between histone modification levels of cCREs and expression of potential target genes. The cutoffs (FDR = 0 .05) for identifying potential H3K27ac-associated active and H3K27me3-associated inactive cCRE-gene pairs are also indicated. c, Representative genome browser view of Olig1 and Olig2 gene locus, both H3K27ac- and H3K27me3-associated cCREs were shown. TSS-proximal regions are marked with green boxes and cCREs are indicated with blue (H3K27ac-specific), brown (H3K27me3-specific) or purple (shared) boxes. d, Venn diagram showing the overlap between predicted H3K27ac- and H3K27me3- associated cCRE-gene pairs. P-value, two-tailed Fisher’s exact test. e, Relative enrichment of the distribution in CRE groups of Fig. 4 for cCREs in H3K27ac-specific, shared and H3K27me3-specific pairs. f, Heatmap showing the enrichments of predicted targeted genes of each promoter group defined in Fig. 3a linked by cCREs of each CRE group defined in Fig. 4. g, Spearman’s Correlations Coefficients between reads densities of cCREs and promoters of putative target genes across cell types for H3K27ac and H3K27me3. P-value, two-tailed Wilcoxon signed-rank test. The boxes were drawn from lower quartile (Q1) to upper quartile (Q3) with the middle line denote the median, whiskers with maximum 1.5 IQR. n = 22 cell types. h, Heatmap showing the histone modification levels at cCREs with potential active roles in expression of putative target gene. cCRE were grouped using K-means clustering based on histone modification levels. i, Heatmap showing the expression levels of corresponding putative target genes of cCREs in (h). j, Top enriched Gene Ontology terms for genes in (i) and the top enriched de novo motifs for cCREs from each group in (h).
