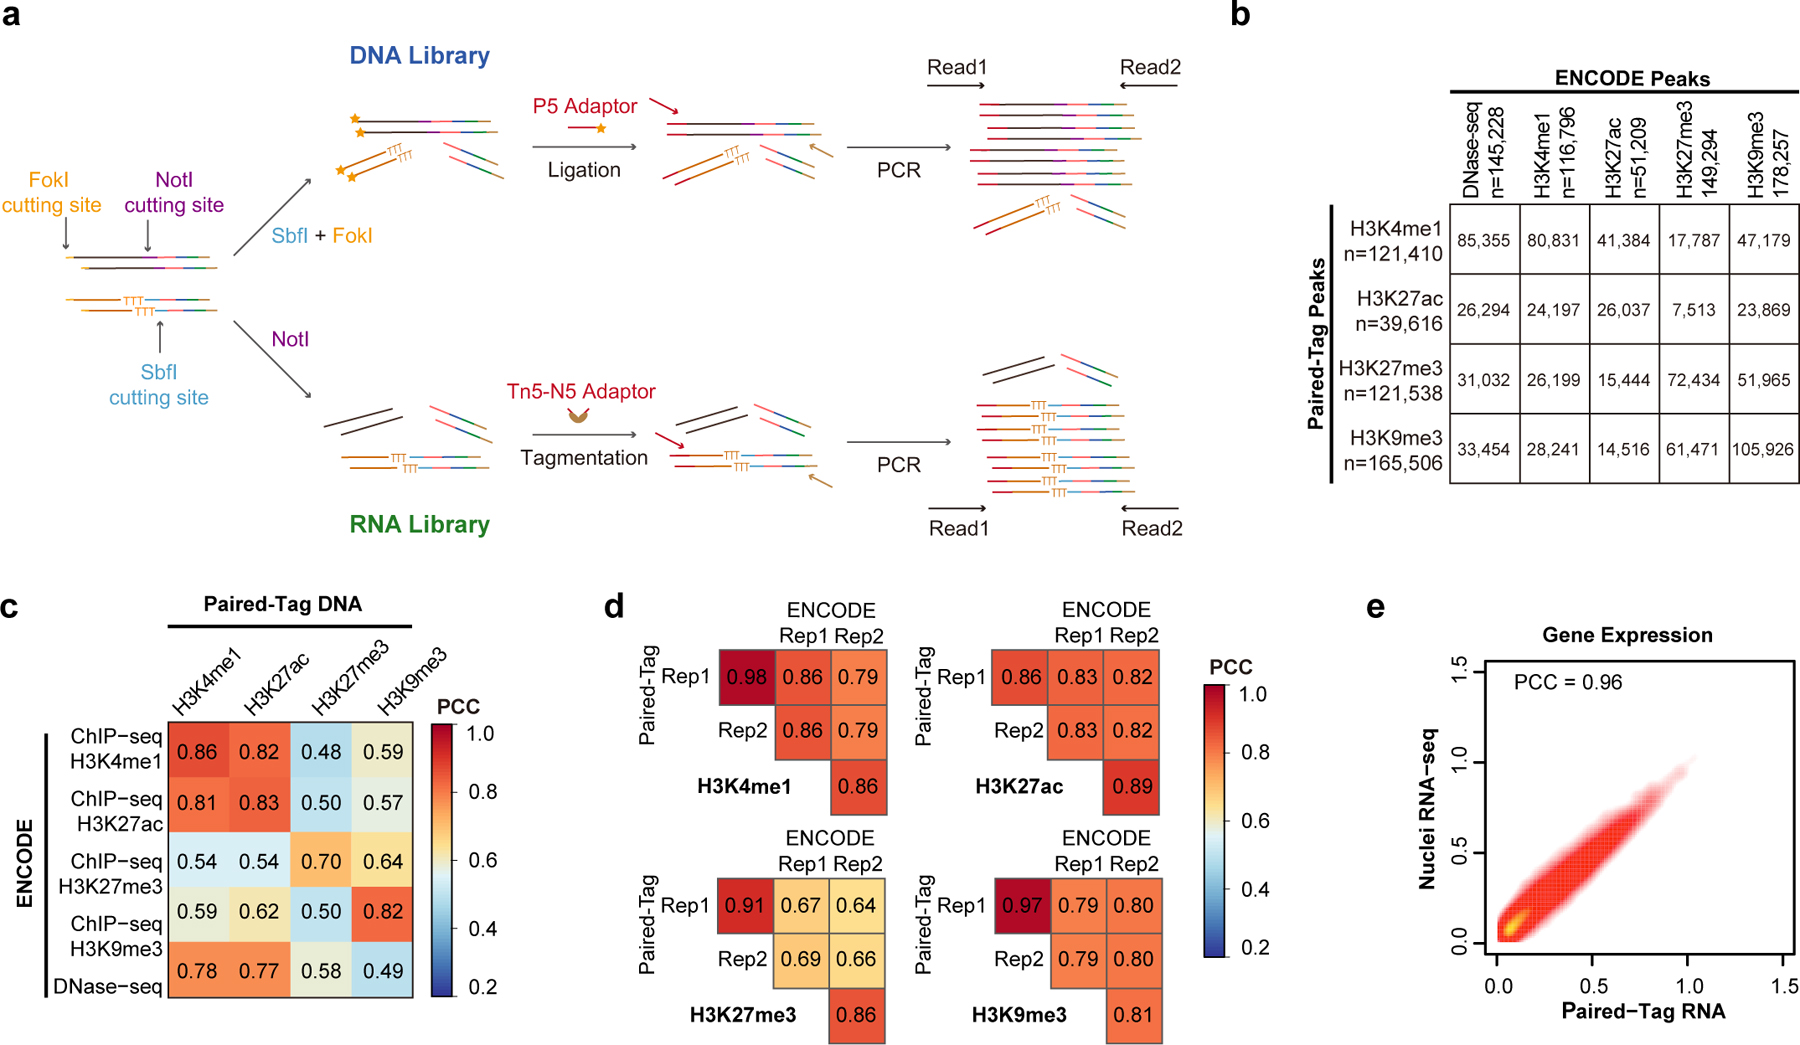
Extended Data Fig. 1. Overview of Paired-Tag.

a, Schematics for 2nd adaptor tagging of DNA and RNA libraries. For DNA libraries, amplified products were digested with a type IIS restriction enzyme – FokI, and the cohesive end was then used to ligate the P5 adaptor. For RNA libraries, N5 adaptor was added by tagmentation. b, Table showing the numbers of overlapped peaks across different histone marks between Paired-Tag and ENCODE ChIP-seq or DNase-seq datasets. The total numbers of peaks identified for each dataset are also indicated. c, d, Heatmaps showing the Pearson’s Correlation Coefficients of genome-wide reads distribution (in 10-kb bins) (c) between Paired-Tag datasets and ENCODE ChIP-seq or DNase-seq datasets, and (d) between replicates of Paired-Tag datasets and ENCODE ChIP-seq datasets from HeLa cells. e, Scatter plot showing the Pearson’s correlation coefficients of Paired-Tag RNA dataset and in-house generated nuclei RNA-seq from HeLa cells.
