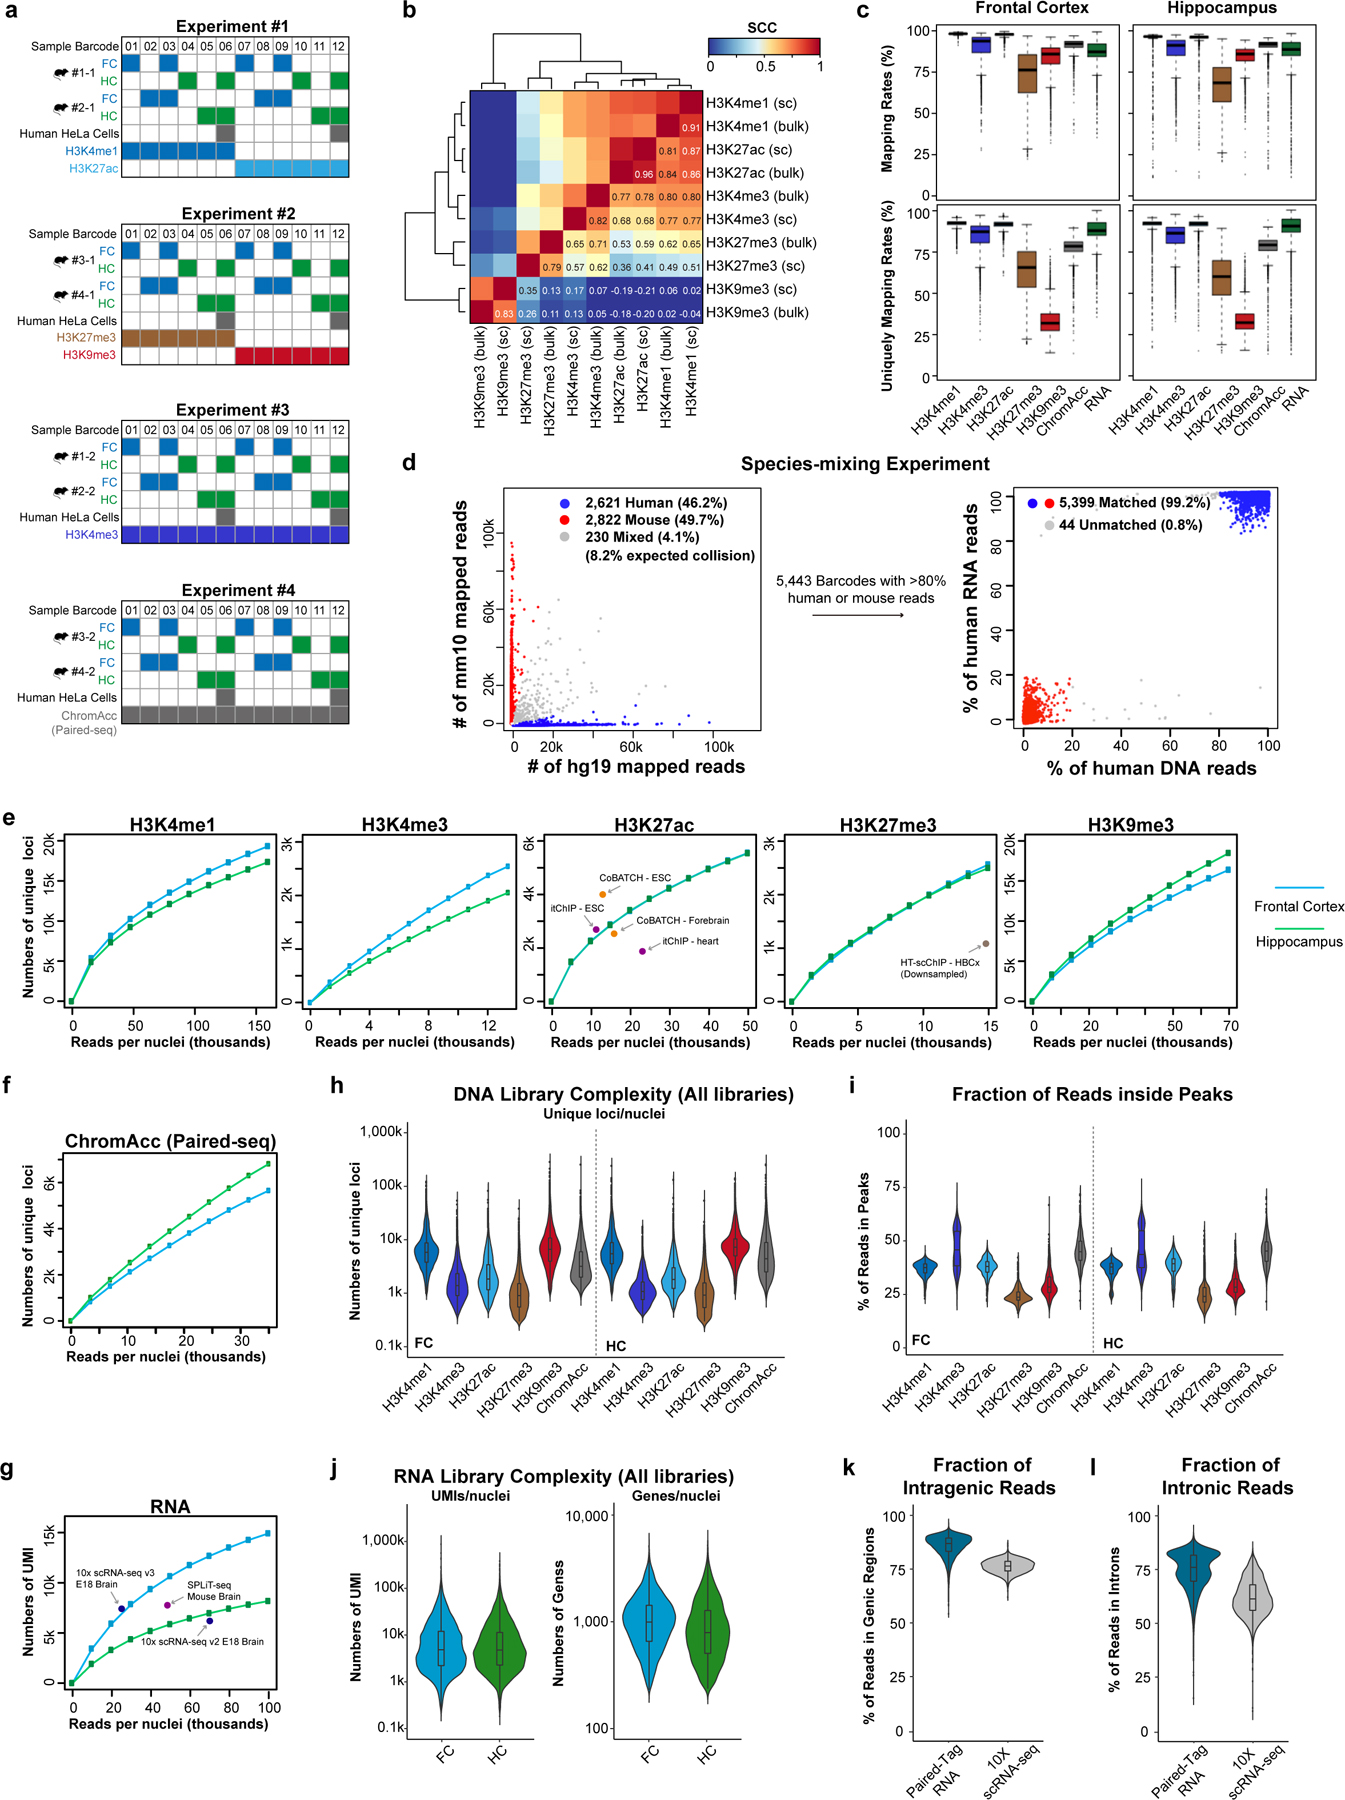
Extended Data Fig. 2. Performances of Paired-Tag in single-nucleus analysis from mouse brain.

a, Schematics showing the sample multiplexing strategy in this study. Different samples or replicates were labeled by the 1st round of Paired-Tag cellular barcode (Sample Barcode) located in reverse transcription primers and transposome oligos. b, Heatmap showing the pair-wise Pearson’s correlation coefficients of genome-wide reads distribution for different histone marks from single-cell Paired-Tag datasets (indicated with “sc”, aggregated from all cells shown in Fig. 2a) and bulk datasets. c, Boxplots showing the mapping rates (upper panels) and the fraction of reads uniquely mapped to the reference genome (bottom panels) of DNA profiles of different histone marks and RNA profiles in frontal cortex and hippocampus. The boxes were drawn from lower quartile (Q1) to upper quartile (Q3) with the middle line denote the median, whiskers with maximum 1.5 IQR, outliers were indicated with dots. For Frontal Cortex, n = 7,781 (H3K4me1), 3,509 (H3K4me3), 7,584 (H3K27ac), 3,891 (H3K27me3), 6,560 (H3K9me3), 6,551 (ChromAcc) from dissections of 2 different mice s and n = 35,876 (RNA) from dissections of 4 different mice; for Hippocampus, n = 5,181 (H3K4me1), 3,956 (H3K4me3), 4,165 (H3K27ac), 2,643 (H3K27me3), 5,484 (H3K9me3), 7,544 (ChromAcc) from dissections of 2 different mice and n = 28,973 (RNA) from dissections of 4 different mice. d, Scatter plots showing the proportion of human and mouse RNA reads in each cell (left panel) and the fraction of human reads in DNA and RNA libraries for each cell (right panel) in the species-mixing experiment. Barcodes with less than 80% reads from the same species were identified as mixed cells, the 230 mixed cells of RNA profiles (left panel) were excluded from plotting of the right panel. e, Numbers of unique loci per nucleus for deeply sequenced H3K4me1, H3K4me3, H3K27ac, H3K27me3 and H3K9me3 DNA profiles down-sampled to different levels. f, Numbers of unique loci per nucleus for deeply sequenced Paired-seq DNA profiles down-sampled to different levels. g, Numbers of UMI per nucleus for the deeply sequenced RNA sub-library down-sampled to different levels. For comparison, the numbers of unique loci per cell from the stand-alone high-throughput scChIP-seq assays and the numbers of UMI per cell from scRNA-seq assays were also shown, indicated by dots with labels. h, Violin plots showing the numbers of unique loci mapped per nucleus for all sequenced DNA libraries (average 35k sequenced reads/nuclei with ~40–60% PCR duplication rates). Median numbers, H3K4me1: 5,770 and 5,443, H3K4me3: 1,392 and 1,081, H3K27ac: 1,842 and 1,803, H3K27me3: 904 and 925, H3K9me3: 6,563 and 7,182, chromatin accessibility: 3,170 and 4,381, for frontal cortex and hippocampus, respectively. i, Violin plots showing the fraction of reads inside peaks for different histone marks and brain regions. For Frontal Cortex, n = 7,781 (H3K4me1), 3,509 (H3K4me3), 7,584 (H3K27ac), 3,891 (H3K27me3), 6,560 (H3K9me3), 6,551 (ChromAcc) from dissections of 2 different mice; for Hippocampus, n = 5,181 (H3K4me1), 3,956 (H3K4me3), 4,165 (H3K27ac), 2,643 (H3K27me3), 5,484 (H3K9me3), 7,544 (ChromAcc) from dissections of 2 different mice. j, Violin plots showing the numbers of UMI and genes detected per nucleus for all sequenced RNA libraries (average 30k sequenced reads/nuclei with ~40–60% PCR duplication rates). Median numbers, 4,215 and 3,568 RNA UMI per nucleus for frontal and hippocampus, respectively. k,l, Violin plots showing the (k) fraction of reads mapped to annotated gene regions (GENCODE GRCm38.p6) and (l) fraction of intronic reads for Paired-Tag RNA datasets and 10X scRNA-seq datasets (10k Brain Cells from an E18 Mouse, V3). n = 35,876 (Frontal Cortex) and 28,973 (Hippocampus) from dissections of 4 different mice. For (h-l), the violin plots were drawn from lower quartile (Q1) to upper quartile (Q3) with the middle line denote the median, whiskers with maximum 1.5 IQR, outliers were indicated with dots.
