
Extended Data Fig. 4. Histone marks-based single-cell clustering.
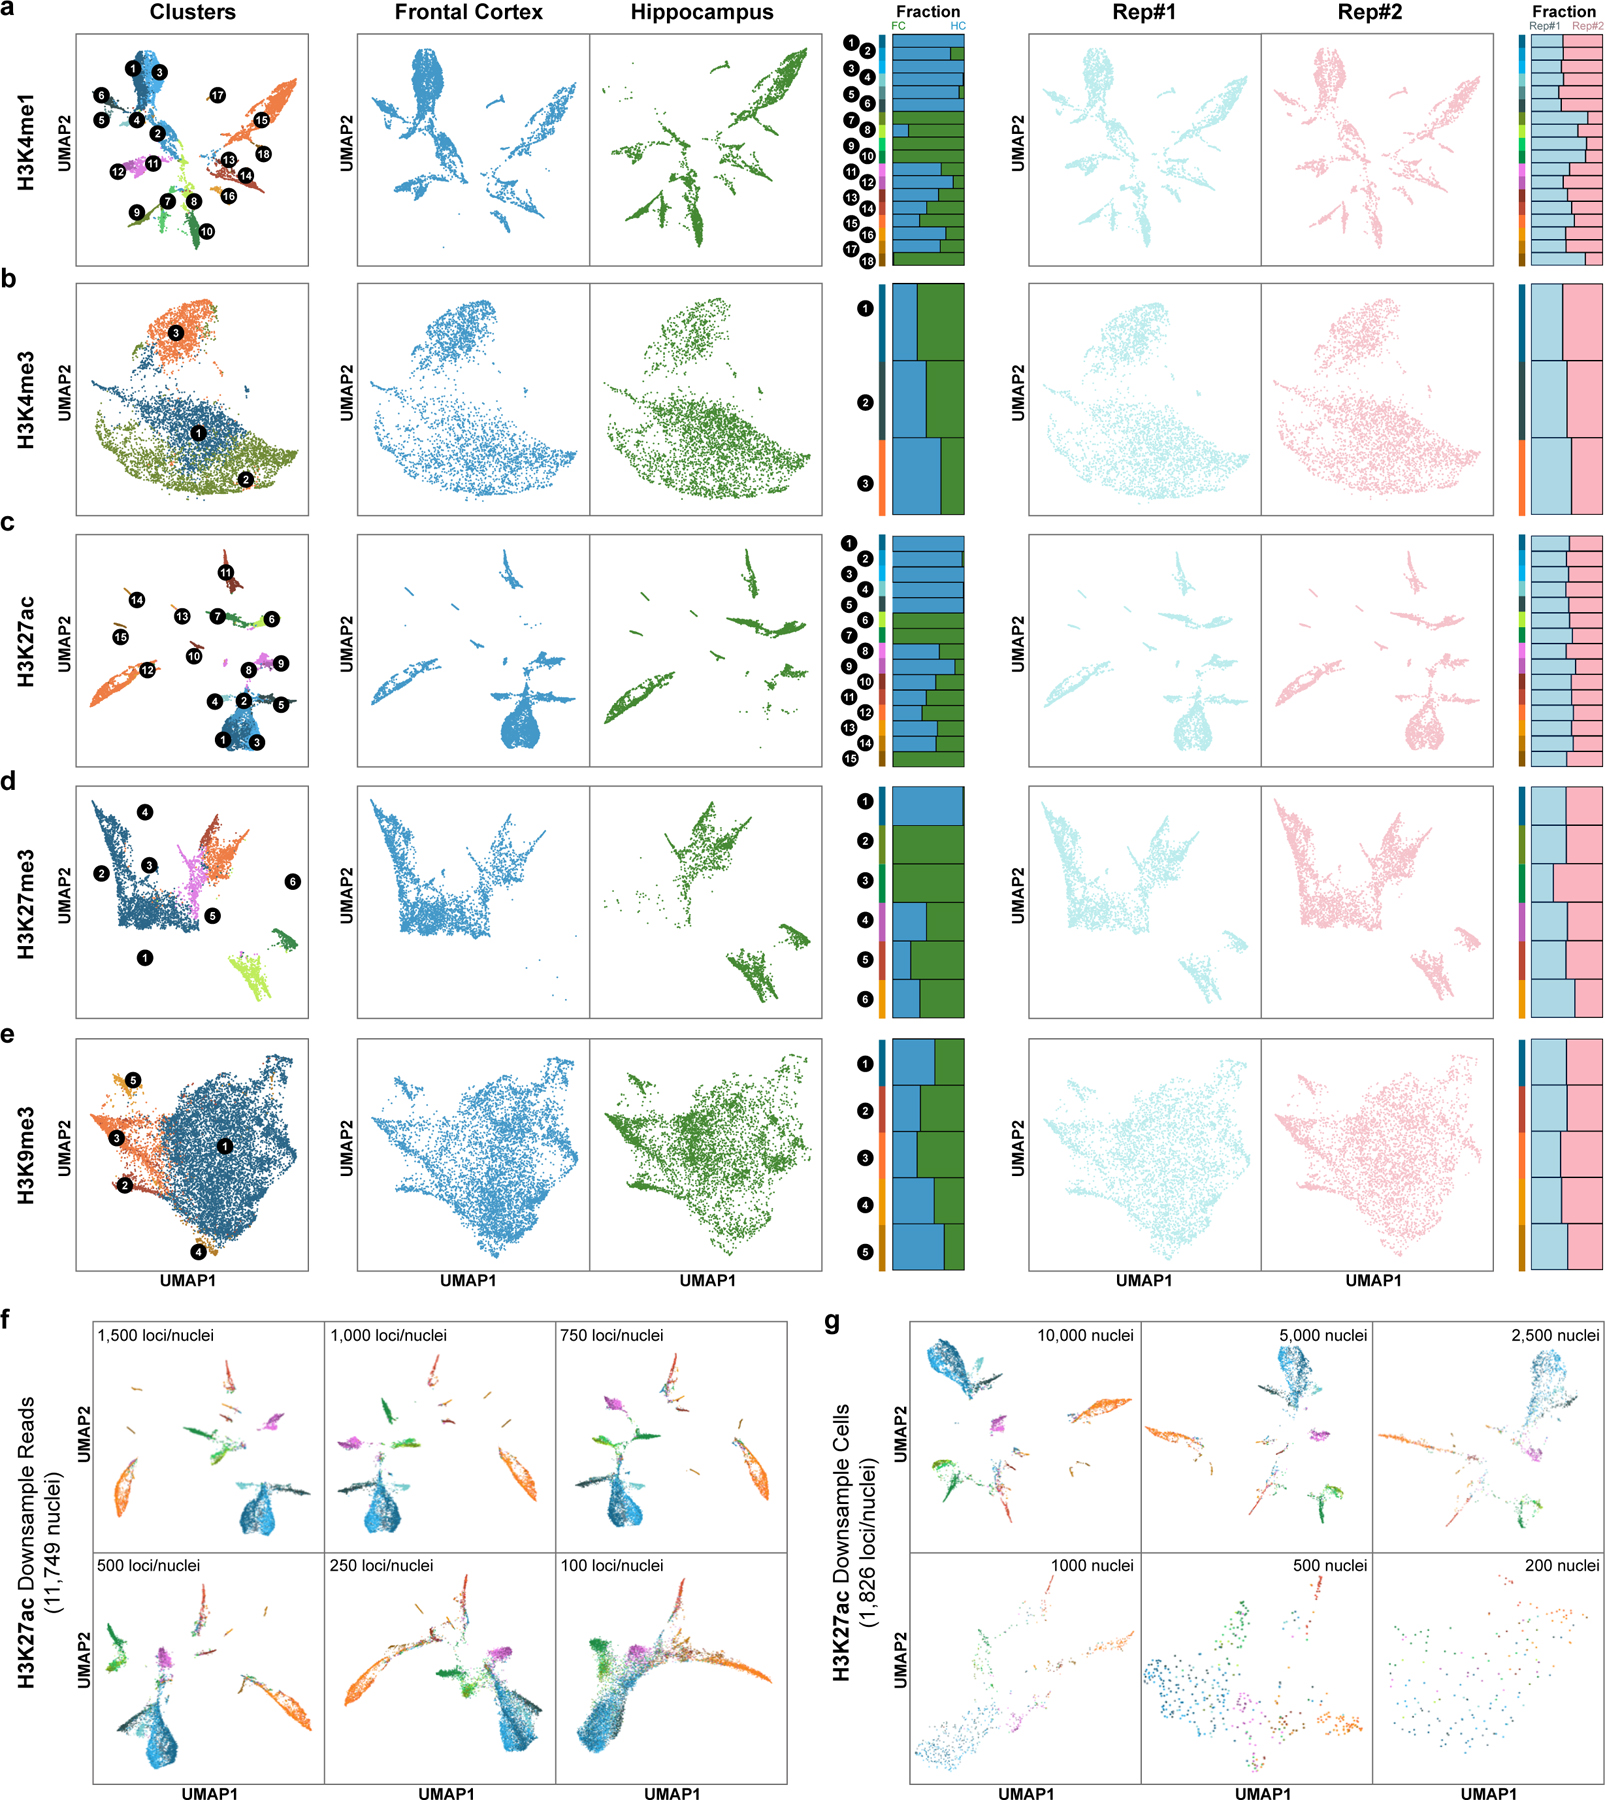
a-e, UMAP embeddings based on (a) H3K4me1, (b) H3K4me3, (c) H3K27ac, (d) H3K27me3 and (e) H3K9me3 DNA profiles and stacked bar plots showing the fraction of cells from each region or replicate. f, UMAP embeddings based on Paired-Tag H3K27ac DNA profiles down-sampled to different sequencing depth (11,749 nuclei, 100 – 1,500 loci/nuclei). g, UMAP embeddings based on Paired-Tag H3K27ac DNA profiles of different numbers of sub-sampled nuclei (median 1,826 loci/nuclei, 200 – 10,000 nuclei). For visualization, cells were colored according to clustering results from Fig. 1d.