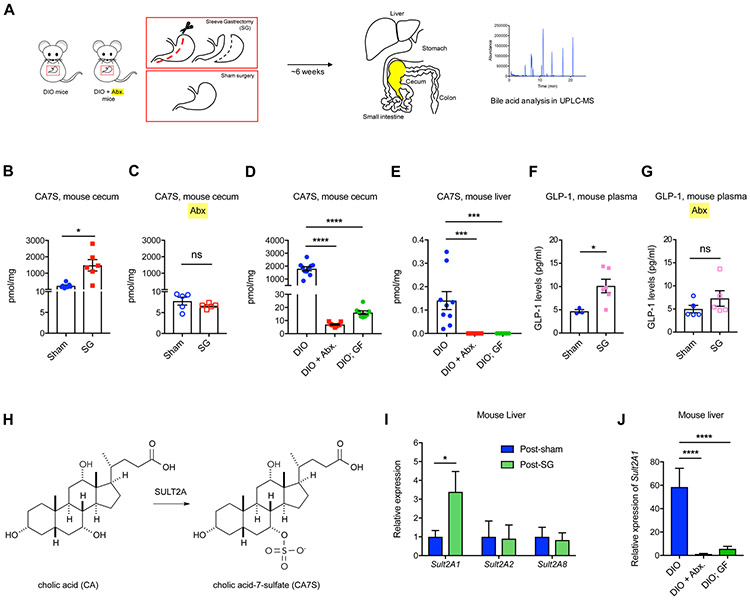
Figure 1. Sleeve Gastrectomy (SG)-mediated increase in levels of CA7S and GLP-1 requires a microbiome.
(A) Schematic of SG and sham surgery in diet-induced obese (DIO) mice treated with or without antibiotics (Abx.).
(B,C) CA7S levels in cecal contents of mice subjected to SG or Sham surgeries treated with or without antibiotics (Abx.) (B, Sham n=7, SG n=6, *p=0.01; C, n=5 in each group, ns=not significant p=0.26, Welch’s t test).
(D,E) CA7S levels in cecal contents (D) and liver (E) of conventional DIO mice were significantly higher than antibiotic-treated (+ Abx.) or GF DIO mice (Cecum: DIO, n=10, DIO + Abx., n=9, DIO; GF, n=8, DIO vs. DIO + Abx. ****p<1.00x10⁻⁴, DIO vs. DIO;GF ****p<1.00x10⁻⁴; Liver: DIO, n=9, DIO + Abx., n=9, DIO; GF, n=8; DIO vs. DIO + Abx. ***p=2.00x10⁻⁴, DIO vs. DIO; GF ***p=5.00x10⁻⁴, one-way ANOVA followed by Dunnett’s multiple comparisons test).
(F,G) GLP-1 levels in systemic circulation of mice subjected to SG or Sham surgeries treated with or without antibiotics. (Data not marked with asterisk(s) are not significant. For F, Sham n=3, SG n=6, *p=0.01; for G, n=5 in each group, p=0.26, Welch’s t test).
(H) The mammalian sulfotransferase enzyme SULT2A (mSULT2A in mice and hSULT2A in humans) catalyzes the conversion of the primary bile acid cholic acid (CA) to cholic acid-7-sulfate (CA7S).
(I) qRT-PCR quantification of mSult2A isoforms reported to sulfate bile acids in the murine liver. Expression levels were normalized to 18S (data not marked with asterisk(s) are not significant. n=11 in each group, mSult2A1 *p=0.04, mSult2A2 p=0.92, mSult2A8 p=0.78, Welch’s t test).
(J) As measured by qRT-PCR, the hepatic expression of mSult2A1 was significantly higher in DIO mice than DIO + Abx. mice and DIO;GF mice. Expression levels were normalized to mouse ribosomal 18S (DIO, n=9, DIO + Abx., n=9, DIO;GF, n=8; DIO vs. DIO + Abx. ****p<1x10⁻⁴, DIO vs. DIO;GF ****p<1x10⁻⁴, one-way ANOVA followed by Dunnett’s multiple comparisons test).
All data are presented as mean ± SEM.

