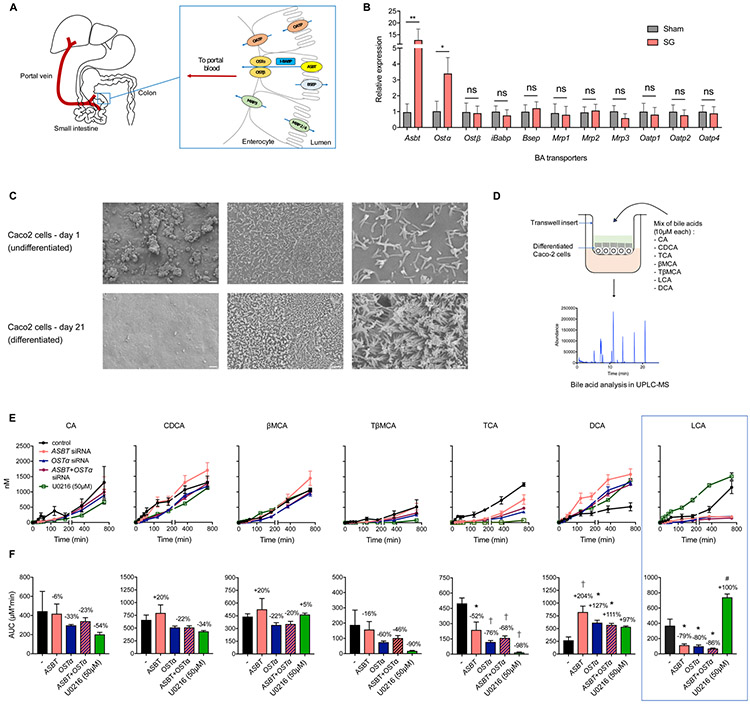
Figure 5. Intestinal BA transport proteins ASBT and OSTα facilitate selective transport of LCA into the portal vein.
(A) Schematic of proteins involved in BA transport from the intestinal lumen into the portal vein.
(B) qRT-PCR quantification of BA transport protein expression levels in sham and SG mouse distal ileum normalized to mouse ribosomal 18S. The expression of Asbt (apical sodium-dependent bile acid transporter) and Ostα (organic solute transporter α) were significantly increased post-SG. (Sham, n=15; SG, n=17; Asbt **p=8.80x10⁻³, Ostα *p=0.04, Ostβ p=0.89, iBabp p=0.76, Bsep p=0.64, Mrp1 p=0.89, Mrp2 p=0.89, Mrp3 p=0.35, Oatp1 p=0.78, Oatp2 p=0.68, Oatp4 p=0.84, ns=not significant, Welch’s t test).
(C) SEM images of undifferentiated and differentiated Caco-2 cells in transwells. Scale bars indicate (L to R): 400 μm, 20 μm, and 4 μm.
(D) Schematic of BA transport study. Caco-2 cells differentiated in transwells were treated with a defined mixture of indicated BAs at 10 μM each, followed by measurement of BA transport to the basolateral chamber.
(E,F) Transport of indicated BAs from the apical chamber across differentiated Caco-2 cells into the basolateral chamber over 12 hours as measured by UPLC-MS. Area-under-the-curve graphs in (F) correspond to timecourses directly above in (E). siRNA-mediated knockdown of ASBT, OSTα, or ASBT+OSTα reduced transport of LCA and TCA, increased transport of DCA, and did not affect transport of CA, CDCA, βMCA, or TβMCA. Treatment with U0126 (50 μM), a small molecule that increases expression of ASBT, increased transport of LCA but not the other BAs tested. (≥3 biological replicates per condition, *p<0.05, #p<0.01 †p<1.00x10⁻³, data not marked are not significant; CA (ASBT) p=0.99, CA (OSTα) p=0.91, CA (ASBT+OSTα) p=0.97, CA (U0126) p=0.65; CDCA (ASBT) p=0.78, CDCA (OSTα) p=0.73, CDCA (ASBT+OSTα) p=0.73, CDCA (U0126) p=0.38; βMCA (ASBT) p=0.81, βMCA (OSTα) p=0.74, βMCA (ASBT+OSTα) p=0.81, βMCA (U0126) p=0.99; TβMCA (ASBT) p=0.99, TβMCA (OSTα) p=0.66, TβMCA (ASBT+OSTα) p=0.83, TβMCA (U0126) p=0.31; TCA (ASBT) *p=0.01, TCA (OSTα) †p=7.00x10⁻⁴, TCA (ASBT+OSTα) †p=1.70x10⁻⁴, TCA (U0126) †p=1.00x10⁻⁴; DCA (ASBT) †p=6.00x10⁻⁴, DCA (OSTα) *p=0.02, DCA (ASBT+OSTα) *p=0.04, DCA (U0126) p=0.08; LCA (ASBT) *p=0.03, LCA (OSTα) *p=0.02, LCA (ASBT+OSTα) *p=0.01, LCA (U0126) #p=2.80x10⁻³, one-way ANOVA followed by Turkey’s (HSD) post-hoc test).
All data are presented as mean ± SEM.

