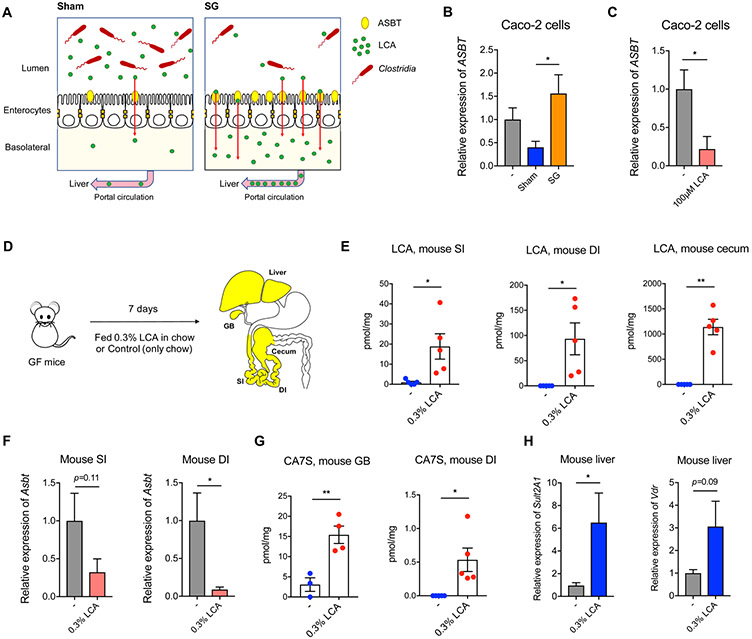
Figure 6. LCA is sufficient to inhibit Asbt expression and induce production of CA7S.
(A) Schematic of sham and SG intestine BA transport modulated by the production of LCA by Clostridia. Levels of Clostridia and LCA production are higher in sham mice. LCA inhibits Asbt expression, resulting in less transport of LCA into the portal vein. In contrast, levels of Clostridia and LCA are lower in SG mice, allowing for higher expression of Asbt and increased transport of LCA from the gut to the liver in SG animals.
(B) The sham cecal pool of BAs inhibited expression of ASBT compared to the SG cecal pool of BAs (3 biological replicates per condition, Sham vs. SG cecal pool *p=0.02, one-way ANOVA followed by Dunnett’s multiple comparisons test
(C) LCA (100 μM) inhibited expression of ASBT in Caco-2 cells. (3 biological replicates per condition, *p=0.02, Welch’s t test).
(D) Schematic of GF mice administered 0.3% LCA (w/w) in chow for 1 week prior to harvesting tissues for analyses.
(E) LCA feeding led to accumulation of LCA in the proximal small intestine (SI), distal ileum (DI) and cecum of GF mice. (n=5 in each group, SI *p=0.04; DI *p=0.04; cecum **p=1.70x10⁻³, Welch’s t test).
(F) LCA inhibited expression of Asbt in SI and DI (n=5 in each group, SI p=0.11; DI *p=0.02, Welch’s t test).
(G) Introduction of LCA in GF mice induced CA7S production and accumulation in the gallbladder (GB) and the distal ileum (DI) (GB, GF n=3, GF+LCA n=4, **p=6.50x10⁻³; DI, n=5 in each group, *p=0.03, Welch’s t test).
(H) LCA feeding led to increased expression of mSult2A1 and Vdr in livers of mice fed 0.3% LCA in chow (n=5 in each group, mSult2A1 *p=0.04, Vdr p=0.09, Welch’s t test).
All data are presented as mean ± SEM.

