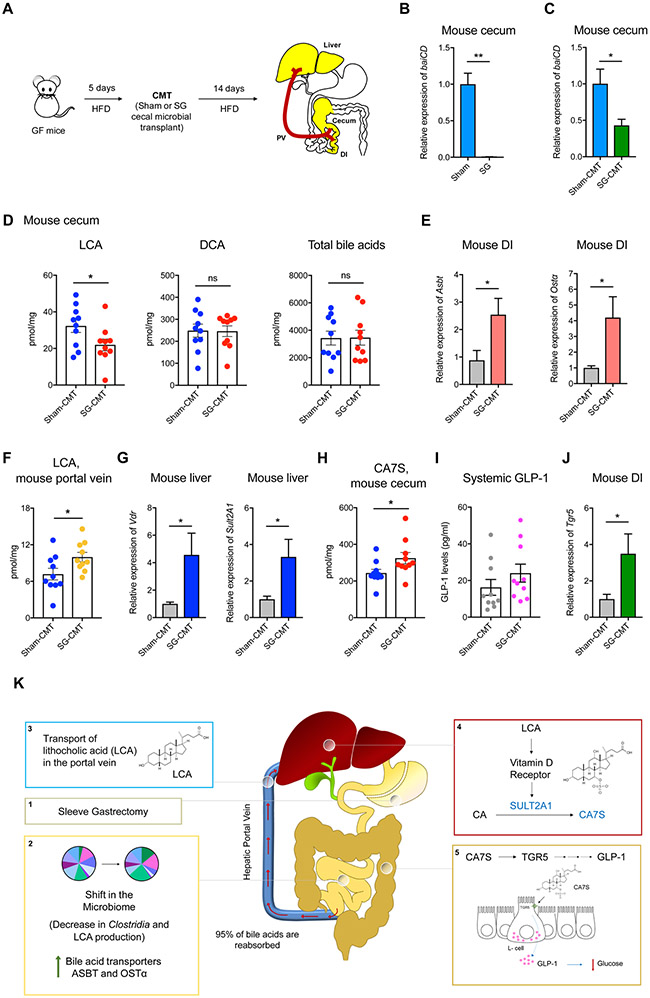
Figure 7. SG microbiota transfer recreates the CA7S pathway in GF mice.
(A) Schematic of cecal microbial transplant (CMT). GF mice were fed a high-fat diet (HFD) for 5 days prior to CMT. Six weeks post-op sham and SG cecal stool were anaerobically homogenized and gavaged into GF animals. Two weeks post-gavage, mice were sacrificed, and their tissues were harvested for analyses.
(B,C) qRT-PCR quantification of baiCD gene cluster expression levels in donor sham and SG mouse cecal contents (B) and recipient sham-CMT and SG-CMT mouse cecal contents (C) normalized to bacterial 16S ribosomal DNA (Sham, n=4, SG, n=4, **p=7.00x10⁻³; Sham-CMT, n=10, SG-CMT, n=10, *p=0.01, Welch’s t test).
(D) LCA levels were reduced in cecal contents of SG-CMT compared to sham-CMT mice. DCA and total bile acid levels did not differ between the two groups (n=10 in each group; LCA, lithocholic acid *p=0.04; DCA, deoxycholic acid p=0.95; Total bile acids p=0.95, ns=not significant, Welch’s t test).
(E) qRT-PCR quantification of BA transport protein expression levels in sham-CMT and SG-CMT mouse distal ileum (DI) normalized to mouse ribosomal 18S. The expression of Asbt (apical sodium-dependent bile acid transporter) and Ostα (organic solute transporter α) were significantly increased in SG-CMT (n=10 in each group, Asbt *p=0.02; Ostα *p=0.02, Welch’s t test).
(F) Portal vein LCA in sham-CMT and SG-CMT mice. LCA was the only bile acid whose levels were significantly increased post-SG (n=10 in each group, LCA *p=0.03, Welch’s t test)
(G) qRT-PCR quantification of mSult2A1 and Vdr expression levels in sham-CMT and SG-CMT mouse livers normalized to mouse ribosomal 18S. mSult2A1 and Vdr expression was significantly increased in SG-CMT (n=10 in each group, mSult2A1 *p=0.02; Vdr *p=0.02, Welch’s t test)
(H) CA7S levels were increased in cecal contents of SG-CMT compared to sham-CMT mice. (n=10 in each group; CA7S, cholic acid-7-sulfate *p=0.04, Welch’s t test).
(I) SG-CMT (cecal microbial transplant) mice have higher levels of GLP-1 compared to Sham-CMT (n=10 in each group, p=0.25, not significant, Welch’s t test).
(J) qRT-PCR quantification of Tgr5 expression levels in sham-CMT and SG-CMT mouse distal ileum (DI) normalized to 18S. Tgr5 expression was significantly increased in SG-CMT (n=10 in each group, Tgr5 *p=0.03, Welch’s t test).
All data are presented as mean ± SEM.
(K) Model for LCA-mediated induction of CA7S synthesis and downstream GLP-1 secretion post-SG. Sleeve gastrectomy (1) results in a shift in the microbiome, specifically a decrease in Clostridia and LCA production, thus inducing an increase of the BA transporters ASBT and OSTα in the intestine (2), which in turn selectively transport LCA into the portal vein (3); LCA is delivered to the liver, where this molecule agonizes VDR, thereby increasing the expression of hSULT2A/mSult2A1 and CA7S synthesis (4). CA7S is then stored in the gallbladder and secreted into the gut. In the colon, CA7S agonizes and increases expression of TGR5 in intestinal L cells, resulting in secretion of GLP-1 (5), an incretin hormone that exerts global glucoregulatory effects.

