
Figure 1. Dose-effect curves from FR (fixed ratio), PR (progressive ratio), and FDC (food-drug choice) drug self-administration procedures.
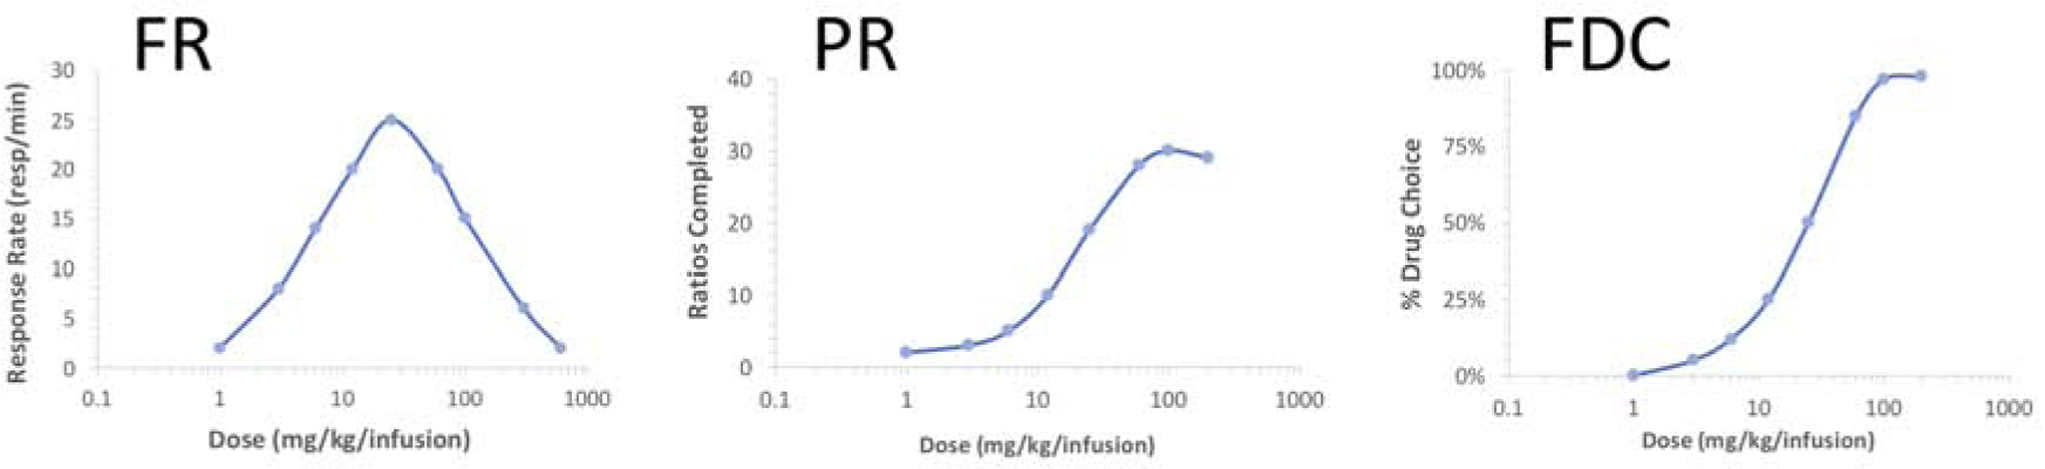
Examples of typical dose-effect curves obtained from drug self-administration procedures using the indicated schedules of reinforcement are shown. Bitonic, inverted U-shaped dose-effect curves are typical of FR schedules, with response rates increasing with increasing dose to a maximal rate at lower doses. Increasing dose further typically leads to decreases in response rate, thought to occur as a result of both rate decreasing effects of higher doses as well as pharmacokinetics. Under the PR schedule, the number of ratios completed (and consequently number of drug infusions) is typically a monotonic function of dose, with decreases in ratios completed after reaching the maximum occurring only at very high doses. Under the FDC schedule, dose-effect curves are also typically a monotonic function of dose, with percentage of trials resulting in drug choice over food increasing with drug dose.