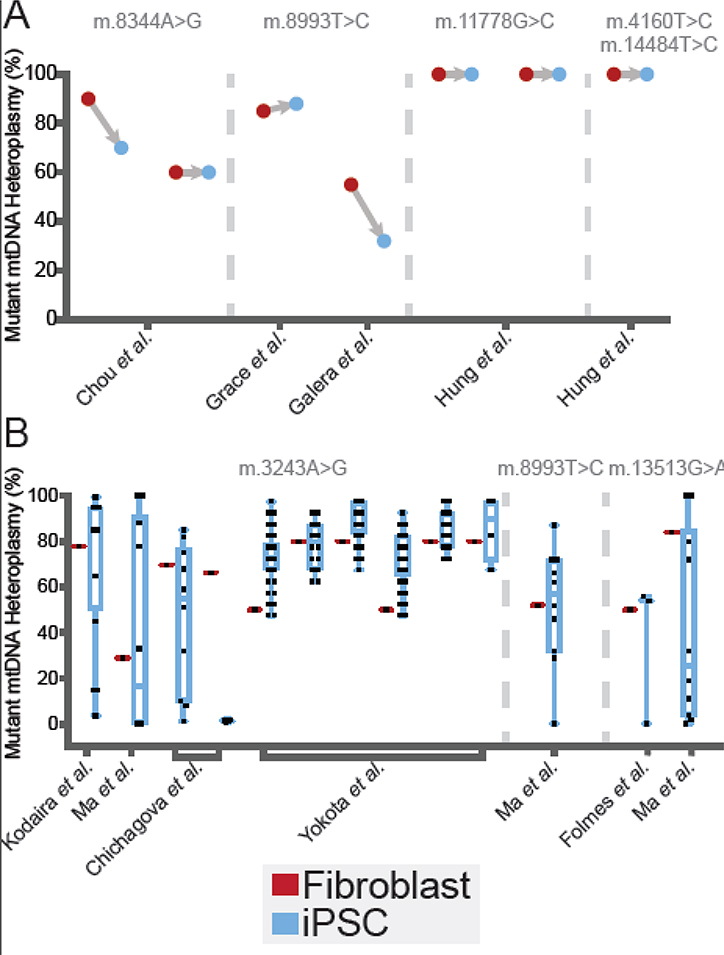
Figure 2.
Meta-Analysis of Heteroplasmy Shifts During Reprogramming. Distributions of measured iPSC clone mutant heteroplasmy from studies listed in Table 1 are plotted alongside the heteroplasmy of the reprogrammed somatic source cells. Reprogrammed somatic cell heteroplasmy is indicated in red and resulting iPSC clone heteroplasmy is indicated in blue. (A) Heteroplasmy shifts measured in a single resulting iPSC clone derived from heteroplasmic starting cell materials. The single iPSC clones analyzed in each experiment are as follows: m.8344A>G from Chou et al. [56], m.8993T>C from Grace et al. [104] and Galera et al. [105], m.11778G>C from Hung et al. [106], and m.4160T>C and m.14484T>C from Hung et al. [106]. (B) Heteroplasmy shifts measured in multiple iPSC clones derived from heteroplasmic starting cell materials. The number of iPSC clones analyzed in each experiment are as follows: m.3243A>G from Kodaira et al. [53] (n= 20, results sourced as averages taken from a binned bar chart and the text), Ma et al. [54] (n=10), Chichagova et al. [55] (listed from left to right: n=10, results sourced from a bar chart and the text, n=4, results sourced from a bar chart and the text), Yokota et al. [22] (results sourced from a bar chart, listed from left to right: n=46, n=18, n=40, n=37, n=20, n=4); m.8993T>C from Ma et al. [54] (n=10); and m.13513G>A from Folmes et al. [48] (n=3), and Ma et al. [54] (n=10).

