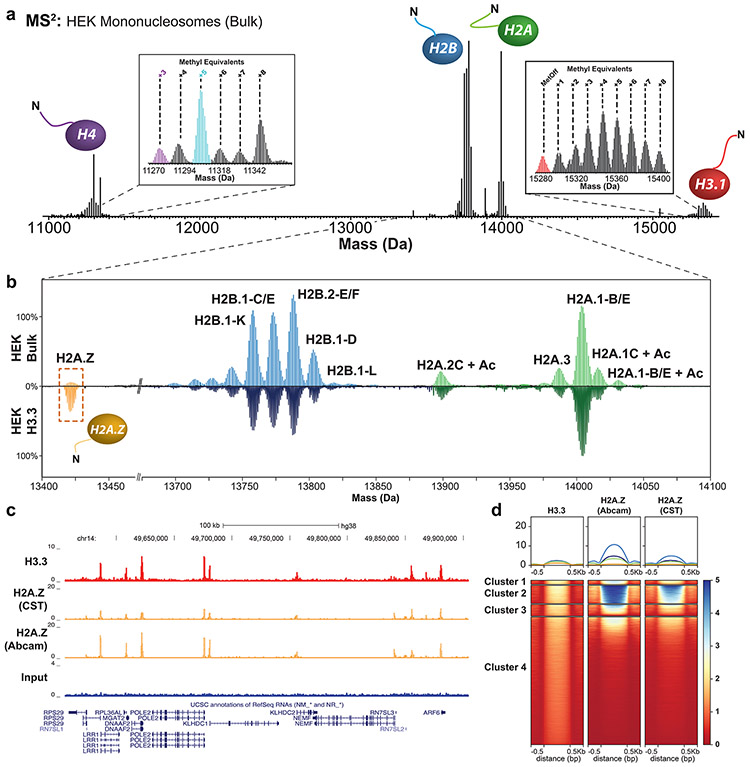
Figure 2. Nuc-MS analysis of endogenous mononucleosomes from HEK cells.
(a) MS2 spectrum of ejected histones from fragmented nucleosomes in the range of 6000-9000 m/z (average of three measurement replicates), demonstrating detection of all core histones and their proteoform distributions. Insets show spectral regions in the mass domain containing the isotopic distributions for H3.1 and H4 proteoforms. The H4 proteoform with five methyl equivalents (highlighted in cyan) was isolated and fragmented to produce the fragmentation map in Supplemental Fig. 7, thus characterizing the proteoform as N-terminally acetylated H4K20me2. (b) Comparison of H2A and H2B proteoform profiles in HEK bulk chromatin (top panel) vs. H3.3-containing nucleosomes (bottom panel), shows latter to be enriched for H2A.Z (yellow box; 14% abundance. All proteoform peaks are normalized to the intensity of the peak of H2A.1-B/E (n = 3). (c) Example tracks from ChIP-seq reads in HEK cells showing input, H3.3 and H2A.Z targets (antibody details in Methods) supporting co-localization of these two variants. (d) Heatmap centered on H3.3 peaks ±0.5 kb showing the correlation of ChIP-seq signal between H3.3 and H2A.Z. Clusters of loci are compositionally defined in Supplemental Fig. 10 and described with gene ontology terms in Supplemental Fig. 19.

