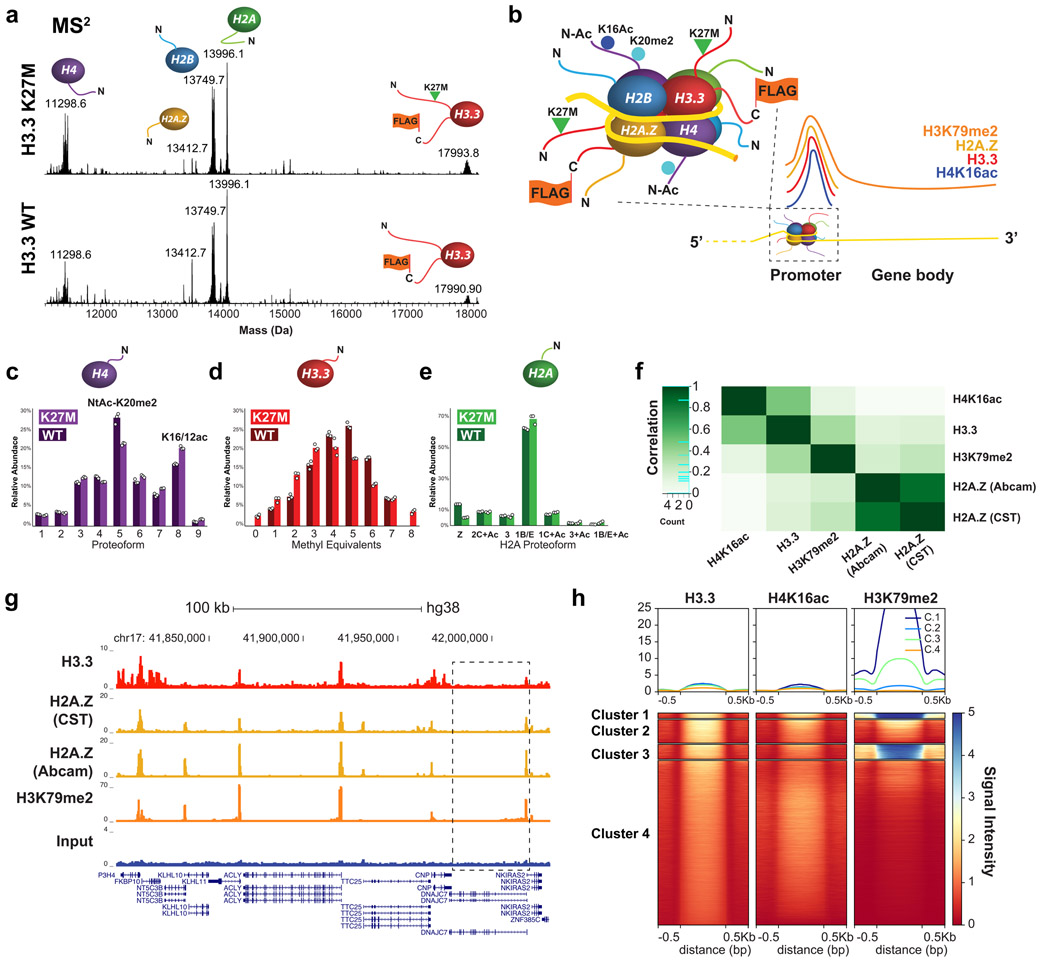
Figure 3. Nuc-MS of endogenous nucleosomes prepared from cells with H3.3-FLAG-HA WT or K27M.
(a) MS2: measurement of the histone proteoforms ejected from mononucleosomes isolated from two cell lines (all measured at isotopic resolution; two biological replicates and three measurement replicates). Mononucleosomes were isolated from 6000-9000 m/z to eject histone proteoforms for MS2 measurement. Note the ~2.5 kDa shift in H3 due to the addition of the FLAG-HA-tag in comparing the MS2 spectra of H3.3-enriched HEK vs HEK bulk mononucleosomes in Fig. 2. (b) Depiction of the composition for the most abundant nucleosomes determined by Nuc-MS, reflecting high enrichment for histone proteoforms and variants present at promoters and highly expressed genes. (c-e) Quantitative analysis of proteoform abundances for ejected histones by MS2. Data points from three replicates are displayed as a scatter plot and ordered left to right according to data file of origin. The mean integrated peak area for each histone proteoform is represented with the histogram. (f) Pearson correlation plot showing association among histone PTMs and variants characterized by Nuc-MS and targeted by ChIP-seq (H3.3, H3K79me2 and H2A.Z, and H4K16ac). (g) Example tracks showing ChIP-seq reads in HEK cells for Input, H3.3, H3K79me2 and H2A.Z support co-localization of the latter three. A zoom-in of the gene highlighted with a black box is in Supplemental Fig. 18. (h) Heatmap centered on H3.3 peaks ±0.5 kb showing the correlation of ChIP-seq signal between H3.3, H3K79me2 and H4K16ac.

