
Figure 5. MTX alters the human gut microbiota ex vivo and in treatment responsive patients.
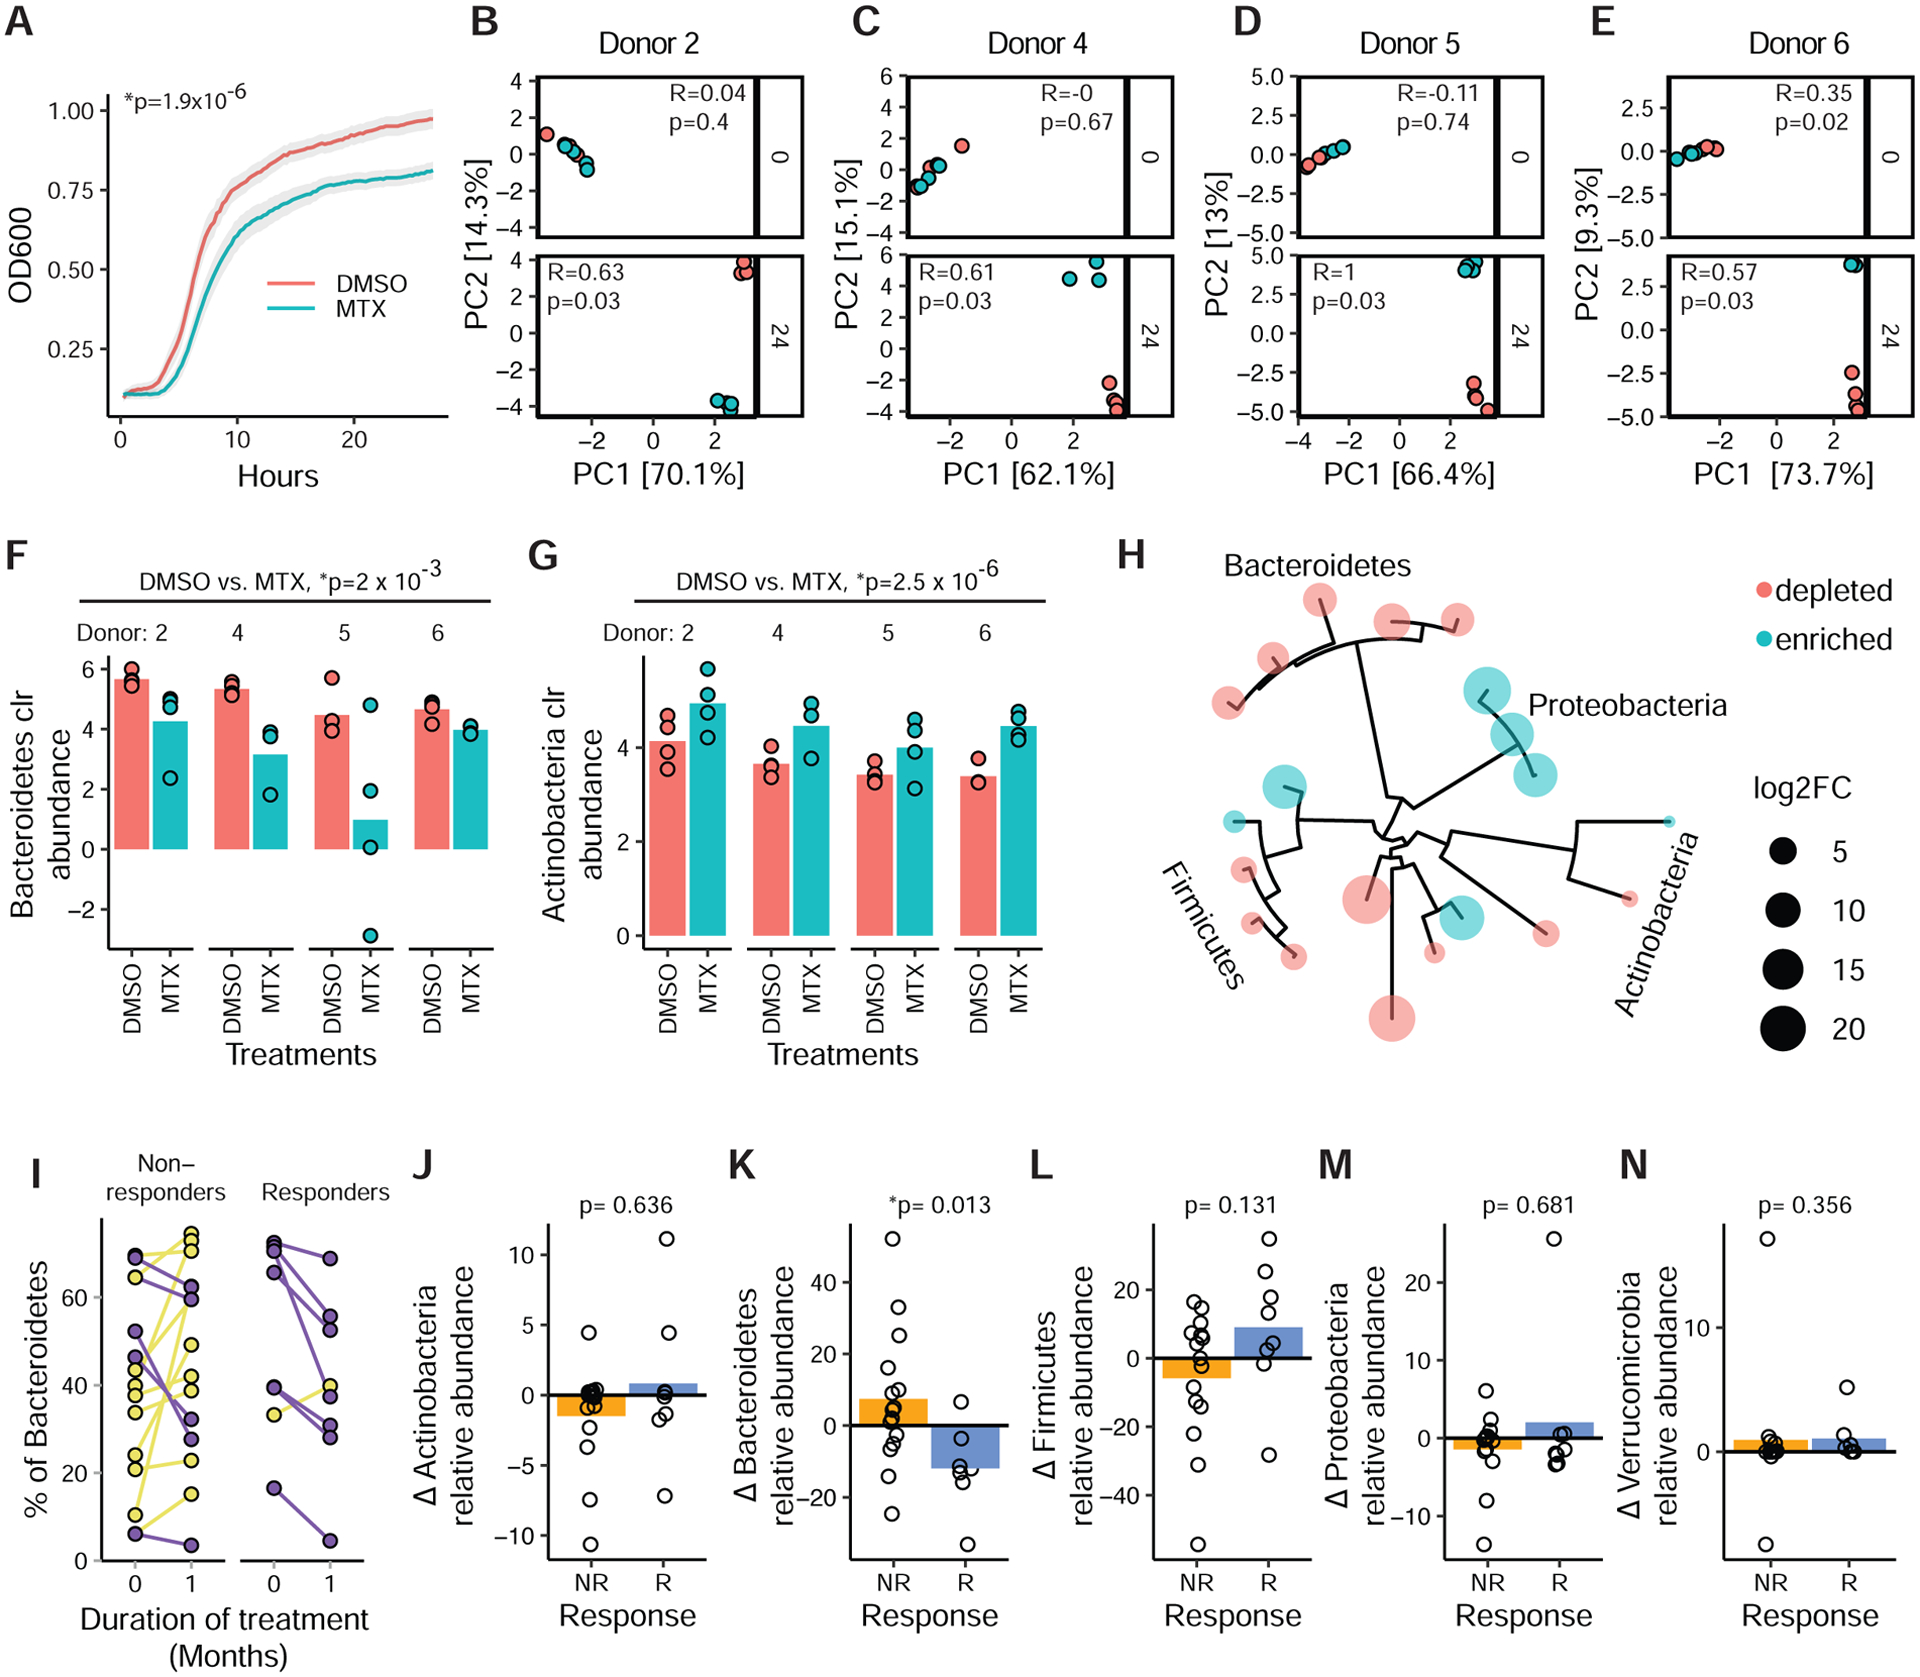
(A) Growth of fecal suspensions from treatment-naive RA patients (n=30, 4 replicates/treatment) in the presence of MTX 100 μg/ml or DMSO. The average growth curves of 30 patients are shown. Shaded areas represent ±SEM. Carrying capacity was reduced (p=1.9×10⁻⁶, paired Student’s t-test).
(B–E) PCA of Euclidean distances using clr-transformed values from ex vivo patient samples (MTX-R) treated with MTX vs. vehicle control at 0 and 24 hours. ANOSIM testing was performed comparing MTX to vehicle control at the different time points.
(F–G) Normalized abundances (clr) of Bacteroidetes (F) and Actinobacteria (G) phylum levels in 4 ex vivo microbial communities treated with MTX (100 μg/ml) or DMSO for 24 hours (n=4 replicates/treatment per patient) (padj<0.01, DESeq comparing DMSO vs. MTX).
(H) Phylogenetic tree of 20 ASVs that are differentially abundant (padj<0.01, DESeq) with MTX treatment ex vivo in 4 patient samples.
(I) Fecal samples from 23 RA patients were subjected to 16S sequencing before treatment with MTX and 1 month after treatment. Relative abundance of Bacteroidetes is shown for each individual (blue, decreased; yellow, increased).
(J–N) Change in relative abundance of 5 major phyla with MTX treatment in responders compared to non-responders (Wilcoxon rank-sum).
See also Figure S4.