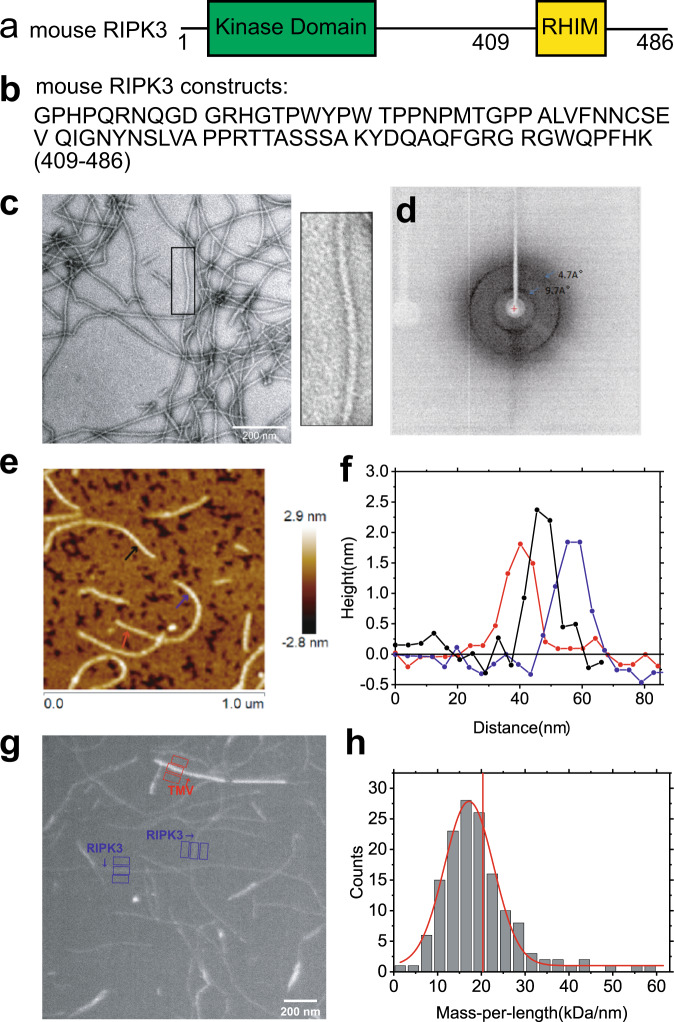
Fig. 2. The EM, X-ray diffraction, and AFM images of mouse RIPK3 fibrils.
a The domain components of the full-length mouse RIPK3. b Protein sequence of mouse RIPK3 construct used for structural elucidation. c Electron micrograph of amyloid fibrils (scale bar 200 nm). Mouse RIPK3 fibrils have the straight, unbranched appearance of typical amyloid fibrils. The picture on the right is an expanded view of the boxed area on the left image. The experiment was repeated for more than 5 times. d The X-ray diffraction of mouse RIPK3 fibrils. The blue arrow indicated equatorial and meridional reflection at about 9.7 Å and 4.7 Å resolutions, respectively. The experiment was repeated for 3 times. e The AFM image of mouse RIPK3 fibrils on mica surface. f The height profile at three positions of mouse RIPK3 fibrils corresponding to the three positions indicated by the arrows in (e), showing fibril diameter about 1.8 ± 0.2 nm. g One BT-TEM image of mouse RIPK3 fibrils, with tobacco mosaic virus (TMV) particles as standards for MPL measurement. h MPL histogram of mouse RIPK3 fibrils derived from BT-TEM images. Vertical red line indicated MPL value of 20.3 kDa/nm, the expected value if a single molecule lies in the cross-β unit of the fibril. The variations in the background intensity is analyzed in Supplementary Fig. 2. Figure 1e was a representative image of nine images from three sample preparations and BT-TEM in Fig. 1g was a representative image of more than 30 images from about ten sample preparations.

