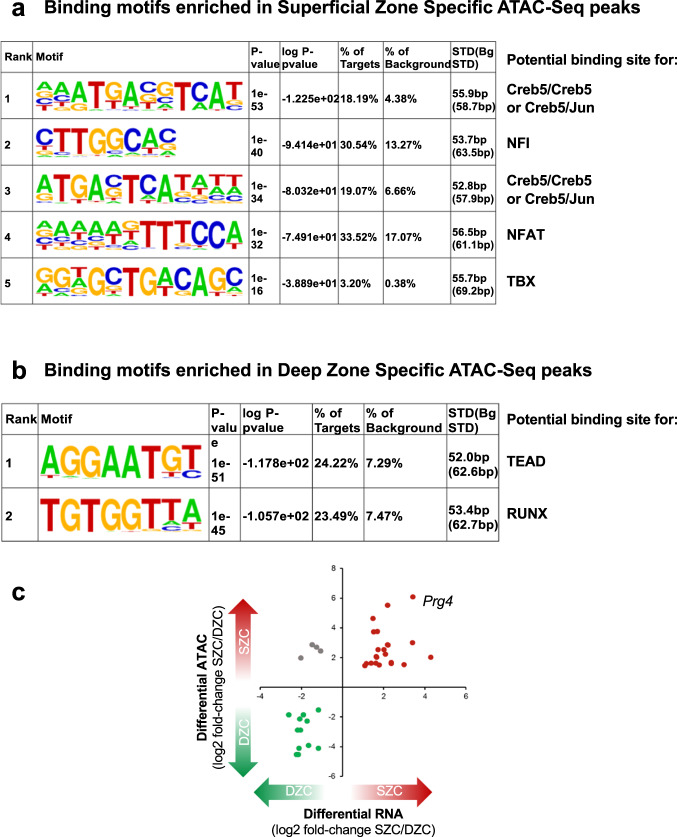
Fig. 6. Transcription factor binding sites that are enriched in ATAC-Seq peaks which display differential accessibility in superficial versus deep zone chondrocytes.
a Homer motif analysis of ATAC-Seq peaks that are enriched in SZCs versus DZCs indicated that binding sites for Creb5, Nfi, Nfat, and Tbx TFs are enriched in superficial zone-specific ATAC-Seq peaks. b Homer motif analysis of ATAC-Seq peaks that are enriched in DZCs versus SZCs indicated that the binding sites for Tead and Runx TFs are enriched in deep zone-specific ATAC-Seq peaks. In both (a, b), the frequency of these sequence motifs in zone-specific ATAC-Seq peaks (% of targets) versus their frequency in the genome (% background) is displayed. c Correlation between ATAC-Seq sites and zone-specific gene expression. A high correlation was observed between zone-specific ATAC-Seq sites (located ≤ 25 kb from the transcription start site) and zone-specific gene expression in both SZCs and DZCs. This correlation was highest at the Prg4 locus, where four distinct regions (E1–E4) were selectively accessible in SZCs.

