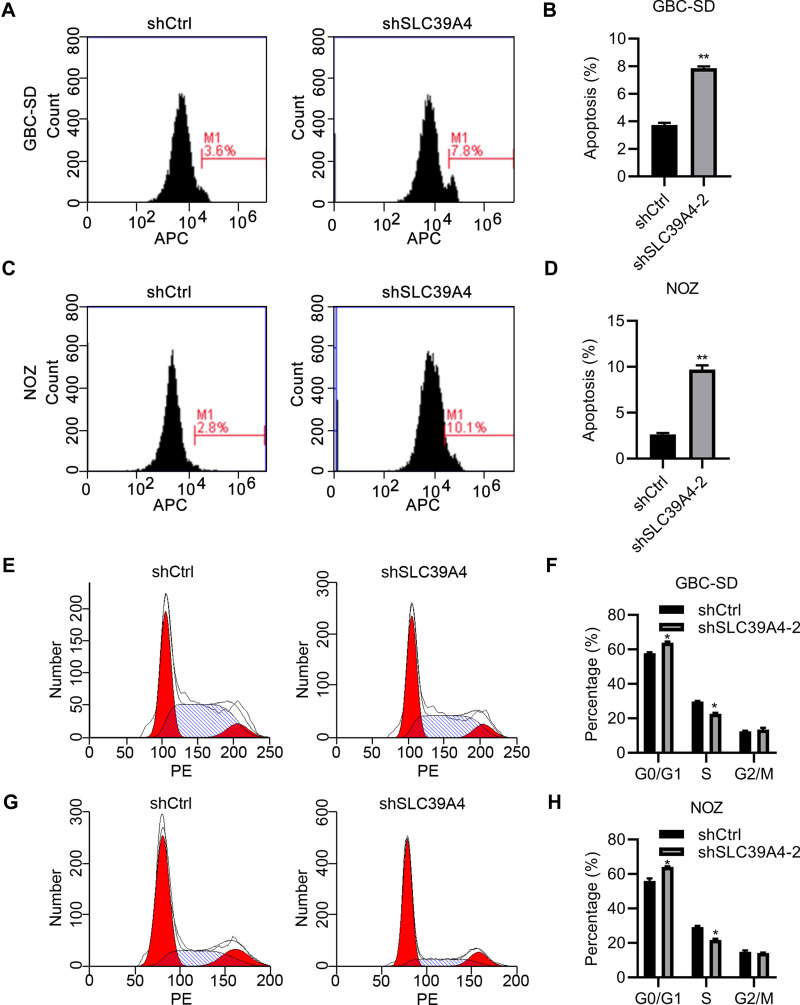
Figure 4.
Knockdown of SLC39A4 expression induced apoptosis and cell-cycle arrest. (A–D) Apoptosis analyses were done in GBC-SD cells and NOZ cells using FACS (A and C), and apoptotic percentages were calculated by normalizing values to the total number of cells (B and D). Data are the mean ± SD (unpaired t-test). **p<0.01, compared with NOZ/shCtrl or GBC-SD/shCtrl. (E–H) Cell-cycle distributions were analyzed by FACS (E and G) and quantitation are shown in (F and H), after normalization to the total cell number. Data are the mean ± SD (unpaired t-test). *p < 0.05, compared with control cells.

