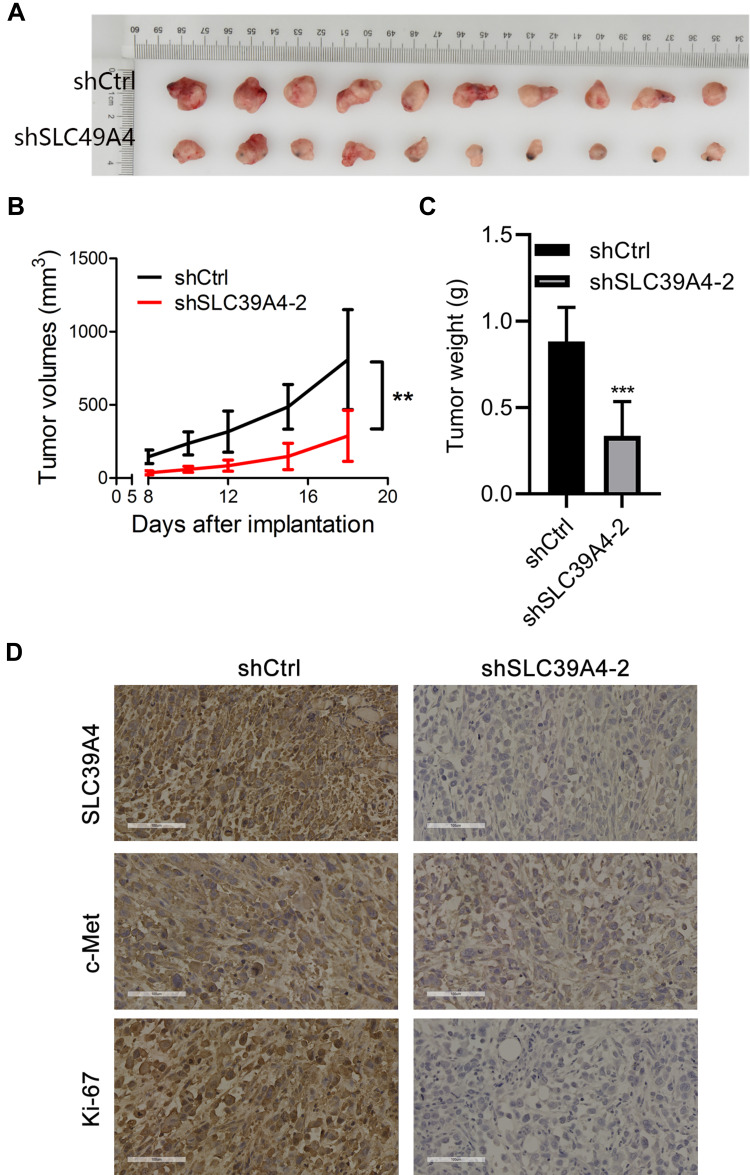
Figure 6.
Knockdown of SLC39A4 expression repressed tumor formation in nude mice. (A) Surgically excised tumor tissue 18 days after initial implantation. (B) Growth curves of subcutaneously implanted tumors. Tumor volumes were measured at the indicated timepoints. (C) Average weight of implanted tumors in NOZ/shSLC39A4-2 xenograft-bearing mice. Data are the mean ± SD (unpaired t-test). **p < 0.01, ***p < 0.001, compared with NOZ/shCtrl. (D) IHC analyses of SLC39A4, c-Met and Ki-67 in tumors of control and shSLC39A4-2 groups. Scale bar, 100 μm.

