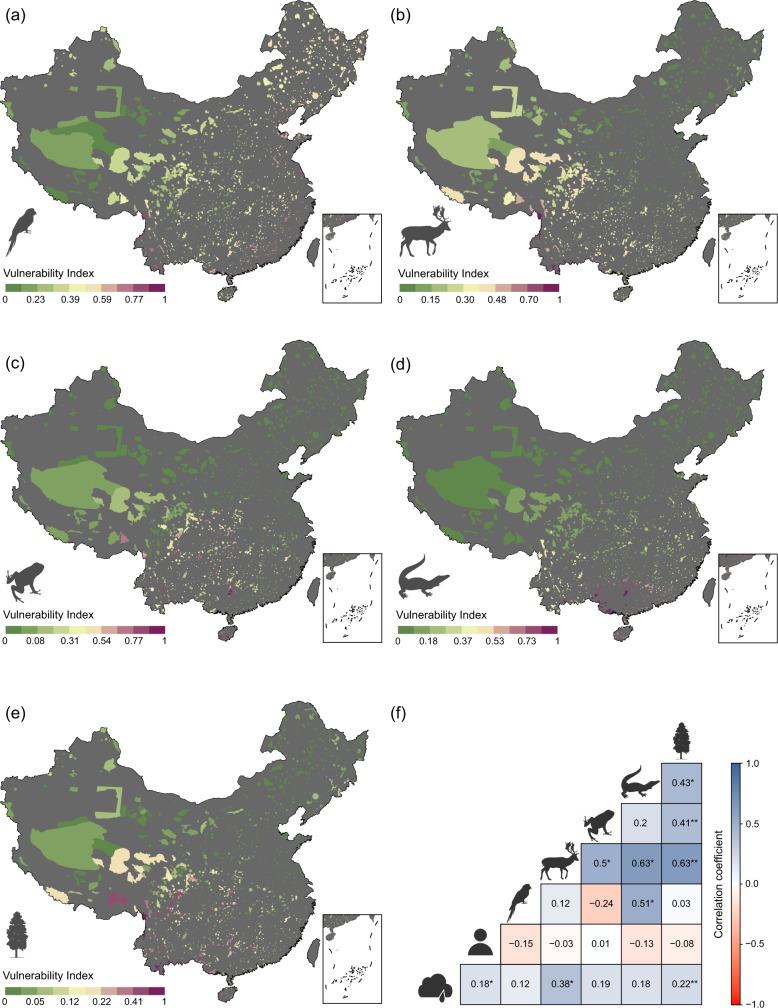
Fig. 2. Spatial patterns of species vulnerabilities across protected areas in China.
a birds, b mammals, c amphibians, d reptiles and e plants. Vulnerability index close to 1 represented by warmer color indicates high species vulnerability (i.e., high diversity of threatened species in general, or a high number of highly threatened species, such as critically endangered, or both). f Pearson’s correlation coefficients between climate, anthropogenic and species vulnerabilities. The significance of the correlation tests was computed using modified t-test. **p < 0.01, *p < 0.05. Values without an asterisk (*) are not significant.

